Chandra Orion star flares
The CASt datasets
Faint_constant.datFaint_flaring.dat
Bright_fiaring.dat
Astronomical background
Our Sun and ordinary stars we see at nighttime appear constant in brightness to our naked eyes. But at other wavelengths of light where the stars are much fainter (such as radio, X-ray and gamma-rays), the stars are violently variable on rapid timescales. These emission arises from explosive releases of energy at the stellar surface associated with magnetic fields. These solar or stellar flares occur when magnetic fields generated in the stellar interior erupt on the surface and, due to convective motions, are twisted until a sudden reconfiguation occurs. The process resembles the spark appearing when two wires are crossed in an electric circuit. The result is a sudden acceleration of particles to extremely high energies, and the heating of gas trapped in magnetic loops to X-ray emitting temperatures (106-108 degrees Kelvin).
Ordinary stars exhibit their highest levels of magnetic activity, and their strongest flares, during the youngest pre-main sequence phases (Feigelson & Montmerle 1999). X-ray telescopes such as the Chandra X-ray Observatory provide an excellent view of these flares. The most extensive dataset obtained in this field was the Chandra Orion Ultradeep Project (COUP), where Chandra observed the Orion Nebula region of young stars for nearly two weeks continuously. The X-ray sources are sometimes very faint with only a handful of photons arriving over the observation, and sometimes orders of magnitude brighter. The arrival times of these photons can be viewed as a Poisson process. These are stationary time series if the source does not flare and non-stationary time series if flares are present.
Dataset
We have extracted time series from three of the 1616 COUP
sources:
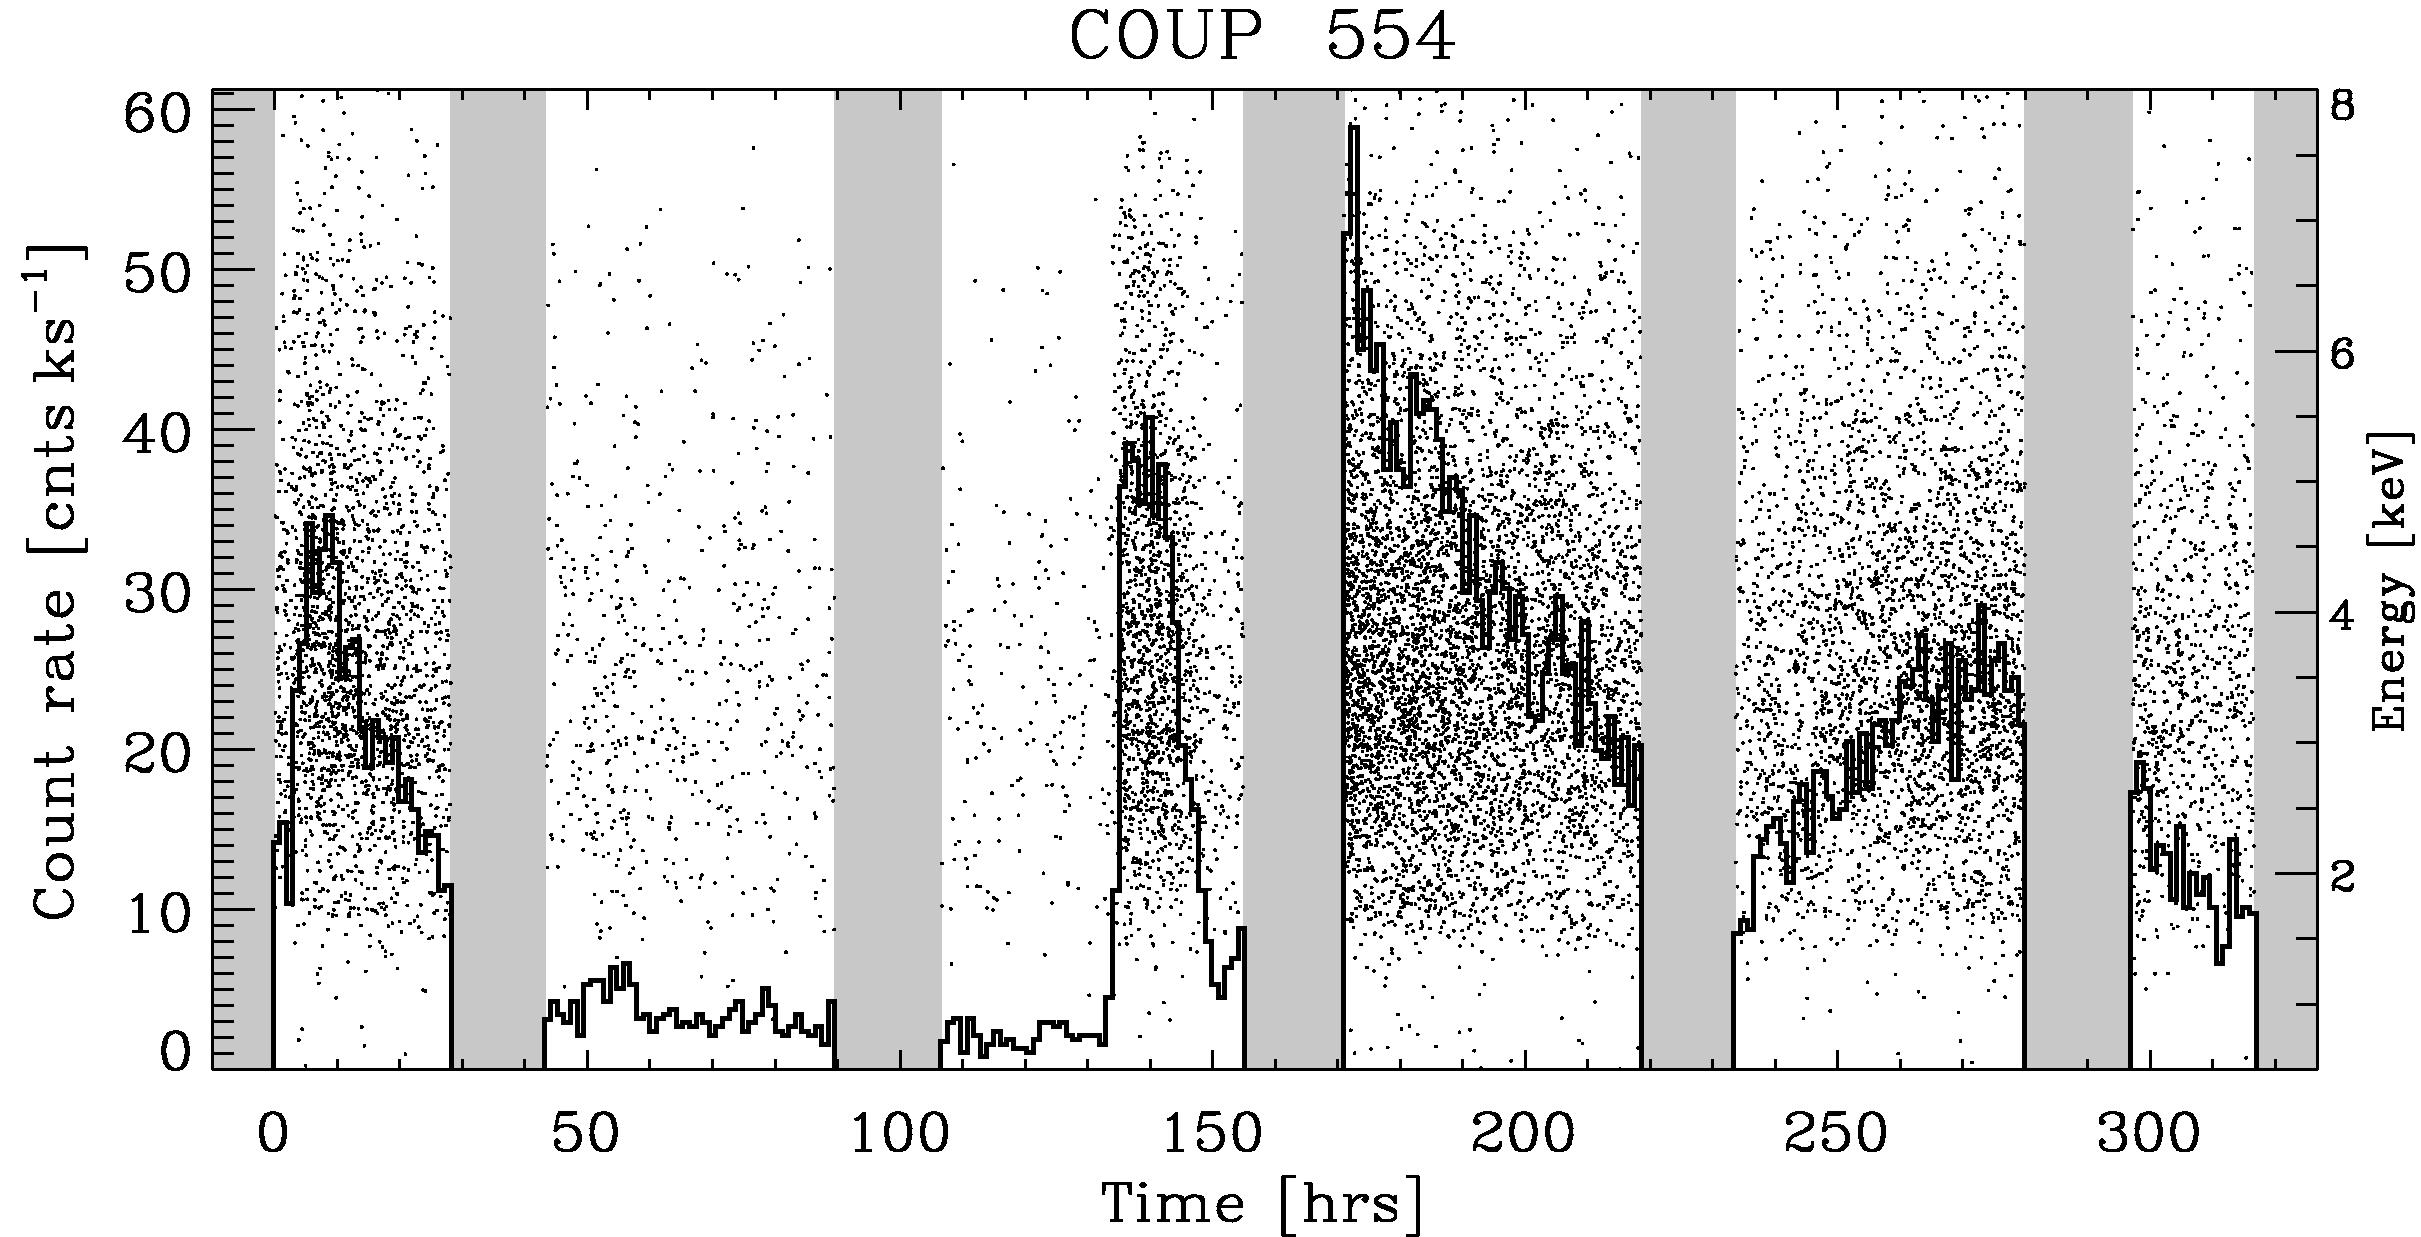
Our datasets are obtained from the extracted Chandra event files (source.evt.fits) with two simplifications. First, only two columns are provided: photon arrival time in seconds (from 0 to 850,000 seconds); and photon energy in keV (from 0.5 to 8.0 keV). Second, 5 gaps associated with the Chandra orbit (readily seen in the lightcurves above) are removed. Thus, the arrival times do not exactly correspond to clock time, but the de-gapped time series is simpler to analyze and scientific information is not seriously compromised.
Statistical exercises
- Establish statistical tests of the hypothesis that the sources are variable which can be applied both low-signal and high-signal sources. Getman et al. (2005a) use the Kolmogorov-Smirnov 1-sample test.
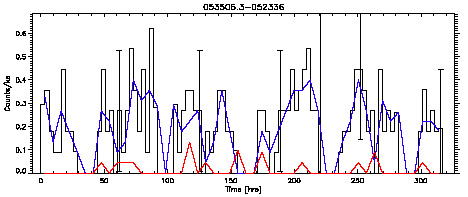
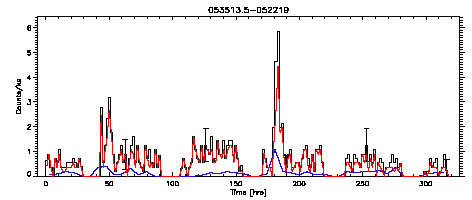
- Segment the dataset into a sequence of constant brightness levels assuming a Poisson process. This is done by Getman et al. (2005a) using the Bayesian Blocks method of Scargle (1998). Here is the Bayesian Blocks segmentation obtained for COUP 551:
- Develop more realistic models or
characterizations of the
variations; e.g. density estimation, wavelet decomposition and
denoising, autoregressive models.
- Consider the photon energies as a
covariate of the
brightness level. Look for hardening of the spectrum (i.e.
higher energy values) at the peak of flares, and cooling (i.e.
decreasing energy values) as the flares decay. Search for
spectral variability in the inter-flare emission.