SDSS quasar dataset
The CASt dataset
SDSS_quasar.datAstronomical background
Most or all large galaxies have a massive black hole (MBH, 106-109 Mo solar masses) at the center. Gas from the interstellar medium or a disrupted star may fall onto the MBH through an accretion disk ("to accrete" means "to fall onto"). This accretion disk can become exceedingly hot and can eject a jet of material at relativistic (near the speed of light) velocities. The disk and jet radiate light across the electromagnetic spectrum (radio, infrared, visible, ultraviolet, X-ray, gamma-ray) with great efficiency. In most galaxies today, like our own Milky Way Galaxy, the MBH is starved of gas and little light is produced. In other galaxies, like Seyfert galaxies or radio galaxies, the light is very strong, particularly in spectral bands other than the visible band where the stars of the host galaxies emit most of their light. In rare cases called quasars, the light from the accreting MBH exceeds the starlight in all spectral bands by enormous factors. These are the brightest objects in the Universe and can be seen even at high redshifts (i.e. great distance from us).
The spectrum, variability and (when resolved in telescopes) structure of quasars are studied in detail to understanding the complex processes of accreting MBHs and their environs. But an important subfield studies consist of wide-field surveys for quasars and characterize their bulk properties such as brightness in various spectral bands, redshifts, and luminosities. Such survey and photometric (brightness) studies lead to classification of quasar subtypes (e.g. Type I, Type II, radio-loud/radio-quiet, BAL, BL Lacs, Lyman-alpha dropouts), to measurement of the quasar luminosity function (distribution of luminosities), and to cosmic evolution studies (how the population changes with redshift).
For many years, quasar surveys produced rather small samples of 101-103 objects. But the Sloan Digital Sky Survey (SDSS) (York et al. 2000) is performing a unique wide-field photometric and spectroscopic survey leading to a well-defined sample of 104 quasars with very precise photometric measurements in five visible bands and accurate redshifts. Some of these also have radio, infrared and X-ray detections from other surveys. The photometric properties from the first SDSS Data Release quasar catalog (Schneider et al. 2003) have been extensively discussed by Richards et al. (2002), Hall et al. (2002), Ivezic et al. (2002), Vignali et al. (2003), Reichard et al. (2003), Pindor et al. (2003), Richards et al. (2003), Pentericci et al. (2003), Zakamska et al. (2003), Wu et al. (2004), Fan et al. (2004), Hopkins et al. (2004), Weinstein et al. (2004), Richards et al. (2004), Collinge et al. (2005), Yip et al. (2005), Yahata et al. (2005), Zakamska et al. (2005), Chiu et al. (2005), Kitsionas et al. (2005), and Vanden Berk et al. (2005). The newer quasar catalog offered here is several times larger than the earlier one and has not yet been studied in detail.
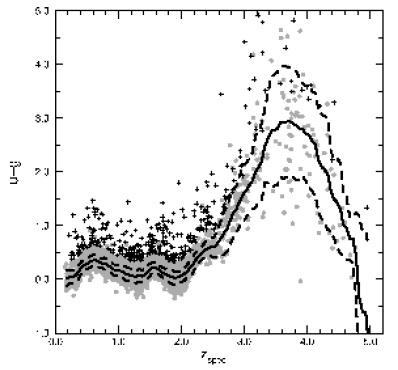
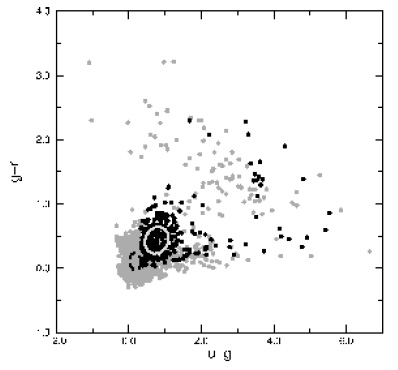
Below are two examples of multivariate relations that were found in the earlier dataset by Weinstein et al. (2004). The first shows the nonlinear relationship between the (u_mag - g_mag) color index and redshift. The second shows the non-Gaussian distribution of quasars in the (g_mag - r_mag) vs. (u_mag - g_mag) color-color plot.
Dataset
The SDSS team has recently
produced a catalog of 46,420 quasars from its 3rd Data Release, 95% of
them previously
unknown. The development of the catalog is presented by Schneider et al. (2005).
The dataset offered here is called SDSS_quasar.dat
has all 46,420 rows but omits some technical columns. The 23 columns
included are:
- SDSS J: SDSS designation
- R.A.: Right Ascension (sky coordinate equivalent to longitude on the Earth, 0 to 360 degrees)
- Dec.: Declination (sky coordinate equivalent to latitude on the Earth, -90 to +90 degrees)
- z: Redshift (scales with distance)
- u_mag: Brightness in the u (ultraviolet) band in magnitudes. Magnitudes are an inverted logarithmic unit of brightness (a quasar with u_mag=16 is 100-times brighter than one with u_mag=21).
- sig_u: Measurement error of u_mag. The heteroscedastic measurement errors for each magnitude are determined by the SDSS team from knowledge of the observing conditions, detector background, and other technical considerations.
- g_mag: Brightness in the g (green) band
- sig_g
- r_mag: Brightness in the r (red) band
- sig_r
- i_mag: Brightness in the i (more red) band
- sig_i
- z_mag: Brightness in the z (even more red) band
- sig_z
- Radio: Brightness in the radio band, in "magnitudes"
scaled
from the flux density measured in the NRAO FIRST survey at 20cm.
"0" indicates the quasar is undetected by FIRST, while "-1" indicates
it was not observed by FIRST.
- X-ray: Brightness in the X-ray band, in log(Count rate)
from
the ROSAT All-Sky Survey (RASS) in the 0.2-2.4 keV band. "-9"
indicates not detected by RASS.
- J: Brightness in the near-infrared J band, in magnitudes,
from
the 2MASS Point Source Catalog.
- sig_J
- H: Brightness in the near-infrared H band
- sig_H
- K: Brightness in the near-infrared K band
- sig_K
- M_i: The absolute magnitude in the i band. This is an inverted logarithmic measure of the intrinsic luminosity of the quasar. A quasar with M_i=-29 is 100-times more luminous than one with M_i=-24.
Statistical exercises
The serious student of this database should examine the
papers
referenced above. Following are some issues that might be
examined:
- In paired ugriz photometry plots, find outliers and compare with measurement errors. Note the survey structure in the i_mag distribution: quasar identifications are complete below i=19 and incomplete for fainter magnitudes.
- Seek a photometric predictor for redshift. This
might
involve a regression of z as a function of ugriz magnitudes and colors
(e.g. u-g, g-r). It is important to quantify the precision of the
predictor as a function of photometric properties.
- Seek redshift dependences (i.e. cosmic evolution) in the
X-ray/optical and X-ray/radio brightness ratios.
- Seek a photometric predictor for radio-loudness.
- Seek a photometric predictor for high-redshift (z>4 or 5). These may appear as outliers in a (u-g) vs. (g-r) color-color plot.
- Study the effect of Lyman-alpha forest absorption.
This
appears as a progressive decline of brightness in the bluer bands with
redshift. By z~5, the ugr colors are all affected compared to i
magnitudes.
- Study relationships between X-ray and optical emission, the ratio (X-ray - i_mag), and other properties.
- Note the complicated structure of plots involving
M_i.
Classify and understanding the origin of different types.
- Study the subclasses of dust-reddened and BAL (broad
absorption
line) quasars. See the complex color vs. redshift distributions
discussed by from an earlier SDSS quasar survey.
For further information on the
SDSS
quasar dataset and astrophysical interpretation of its structure,
please contact
Daniel Vanden Berk (Penn
State University)