Shapley galaxy dataset
The CASt dataset
Shapley_galaxy.datAstronomical background
The distribution of galaxies in space is strongly clustered. The Milky Way Galaxy resides in its Local Group which lies on the outskirts of the Virgo Cluster of galaxies, which in turn is part of the Local Supercluster. Similar structures of galaxies are seen at greater distances, and collectively the phenomenon is known as the Large Scale Structure (LSS) of the Universe. The clustering is hierarchical, nonlinear, and anisotropic. The latter property is manifested as galaxies concentrating in huge flattened, curved superclusters surrounding "voids", resembling a collection of soap bubbles.
The basic characteristics of the LSS are now understood astrophysically as arising from the gravitational attraction of matter in the Universe expanding from the Big Bang ~14 billion years ago. The particular three-dimensional patterns are well-reproduced by simulations requiring that attractive Cold Dark Matter and repulsive Dark Energy are present in addition to attractive baryonic (ordinary) matter. The properties of baryonic and dark components needed to explain LSS agree very well with those needed to explain the fluctuations of the cosmic microwave background and other results from observational cosmology.
Despite this fundamental understanding, there is considerable interest in understanding the details of galaxy clustering; e.g. the processes of collision and merging of rich galaxy clusters. The richest nearby supercluster of interacting galaxy clusters is called the Shapley Concentration. It includes several clusters from the Abell catalog of rich galaxy clusters seen in the optical band, and a complex and massive hot gaseous medium seen in the X-ray band. Optical measurement of galaxy redshifts provide crucial information but represent an uncertain convolution of the galaxy distance and gravitational effects of the clusters in which they reside. The distance effect comes from the universal expansion from the Big Bang, where the recessional velocity (galaxy redshift) follows Hubble's Law v=Hod, where v is the velocity in km/s, d is the galaxy distance from us in Mpc (million parsecs, 1 pc~3 light years), and Ho is Hubble's constant known to be about 72 km/s/Mpc. The cluster gravitational effects must be estimated or simulated for individual galaxies.
Dataset
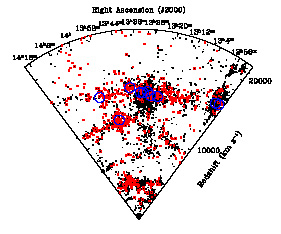
Redshifts (i.e. velocities in km/s with respect to us) are now
measured
for 4215 galaxies in the Shapley Concentration regions (Drinkwater et al. 2004).
Below shows a plot of the redshifts as a function of right ascension, a
positional coordinate in the sky.
The dataset has the following columns:
- R.A. = Right ascension: Coordinate in the sky similar to longitude on Earth, 0 to 360 degrees
- Dec. = Declination: Coordinate in the sky similar to latitude on Earth, -90 to +90 degrees
- Mag = Magnitude: An inverted logarithmic measure of galaxy brightness in the optical band. A Mag=17 galaxy is 100-times fainter than a Mag=12 galaxy. Value is missing for some galaxies.
- V = Velocity: Speed of the galaxy moving away from Earth, after various corrections are applied
- SigV = Sigma of velocity: Heteroscedastic measurement error known for each individual velocity mesurement
Statistical exercises
- Apply and compare a variety of multivariate clustering algorithms to this dataset. Astronomers often use single-linkage nonparametric hierarchical agglomeration which they call the `friends-of-friends algorithm'.
- Examine the effects of non-standard metrics in the
clustering
calculation: spherical vs. Euclidean geometry, mass-weighted points
(log-mass scales with log-luminosity which scales with -2.5*Mag)
- Apply maximum likelihood mixture models assuming individual
clusters are multivariate normals; examine penalized likelihoods like
the Bayesian Information Criterions to choose the `best' model
- Apply wavelet decomposition, with both standard and anisotropic bases (e.g. curvelets, ridgelets) to elucidate the hierarchical structure
- Estimate the `void probabiliity distribution' or otherwise quantify the regions with low galaxy densities
- Evaluate the `fingers of God' effect: a distortion in the velocity dispersion of the densest regions due in large part to the gravitational potential of the Dark Matter and intracluster gaseous medium.
This dataset was generously made available by Michael Drinkwater, University of Queensland.