Research
Activity of the Sun is defined by eruptive events like Coronal mass ejections (CMEs) and flares occurring in the ARs. Solar flare is a sudden release of energy resulting in acceleration of particles and plasma flows and heat. Large flares can be accompanied by highly energetic particles that pose hazards ranging from excessive levels of harmful radiation to disruption and/or destruction of satellites in space. CMEs are energetic events in which the plasma that was initially entrapped in closed coronal magnetic field lines is ejected into interplanetary space. They propagate through the interplanetary medium with speeds up to a maximum of 3000 km/s. Sometimes CMEs precede flares and sometimes not, which are now referred to eruptive and confined flares, to bridge the gap between flares and CMEs.It is believed that these events occur due to release of energy which is pre-stored in the magnetic field in stressed form by constantly straining plasma motions. When the AR magnetic system reaches a critical point of stored energy, it releases as an unavoidable eruption. Major fundamental questions in the field of MHD include how these events trigger and what mechanism drives them. On this line, my research interests on solar eruptions include flux rope formation and CME initiation, Sun-Earth connection of flux rope CMEs, quasi-static evolution of AR magnetic structure and topological study, data driven MHD simulations of AR magnetic structure and global Sun. Recent research projects are briefly described below.
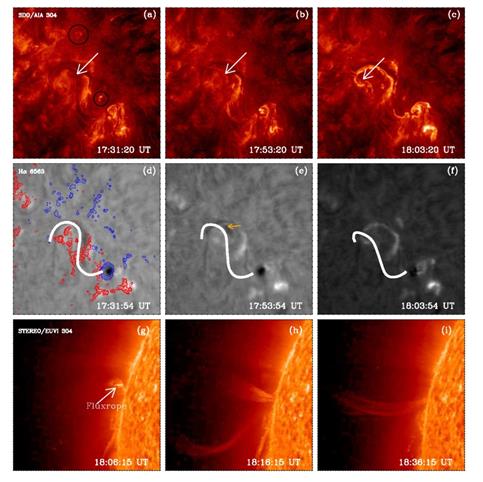
Recent direct evidences of the flux rope come into existence as a conspicuous channel structure in the inner corona of the AR before and during a solar eruption (Zhang et al. 2012, Vemareddy et al 2012, and see Figure 1). This channel initially appears as a twisted and writhed sigmoidal structure in high temperature passbands. The channel evolves toward a semi-circular shape in the slow rise phase and then erupts upward rapidly in the impulsive acceleration phase, producing the front-cavity core components of the resulting CME (Zhang et al. 2012). The role of this hot channel in the eruption process is similar to that of flux rope in many numerical models (e.g., Aulanier et al. 2010; Fan & Gibson 2007) reproducing key features of eruptions. Filament channels are also regarded as flux ropes, which were recently recognized by Atmospheric Imaging Assembly onboard Solar Dynamics Observatory.
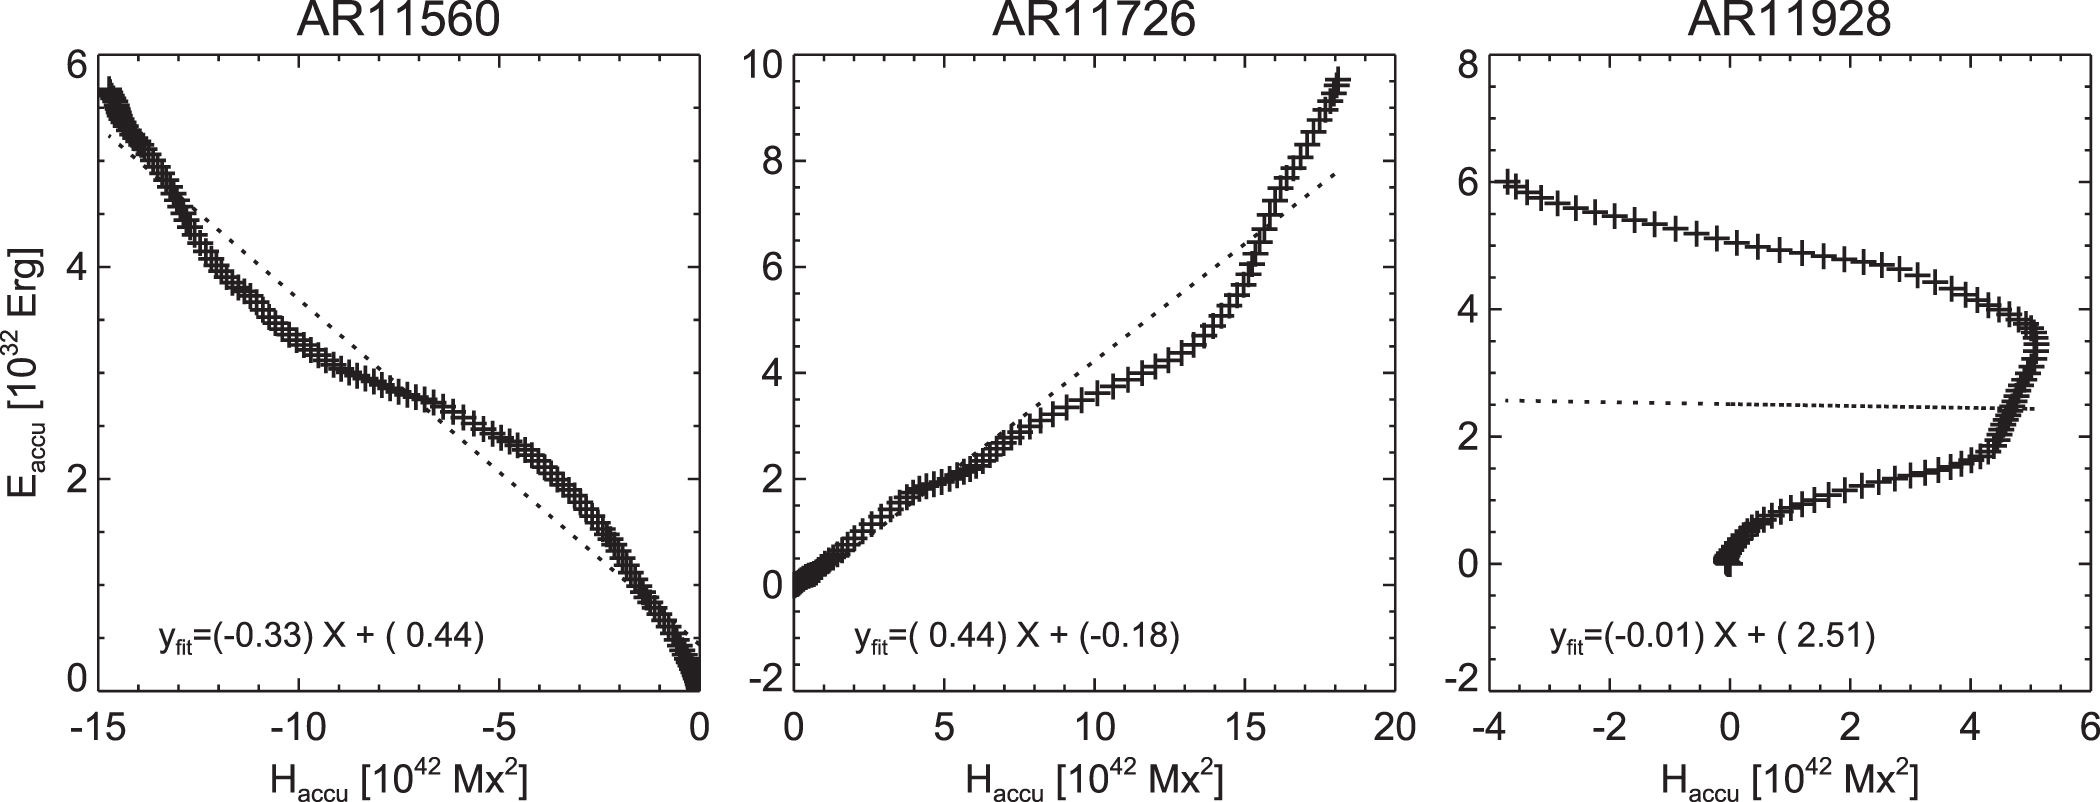
Magnetic helicity is an important topological property of solar active regions (ARs) and is a measure of twist and writhe of the field lines (Berger & Field 1984; Finn & Antonsen 1985). To derive the time rate of helicity injection by these plasma motions, time sequence of photospheric magnetic field are being used. In a study of three emerging ARs (Vemareddy 2015), we found that the coronal helicity flux is dominantly coming from the shear term that is related to horizontal flux motions, whereas energy flux is dominantly contributed by the emergence term. Moreover, the ARs with same sign of Helicity-flux over time are found to launch CMEs but NOT in the one with helicity flux changing sign over time. And the non-linear curve of coronal energy vs helcity is approximately fitted with linear force-free model.
During the evolution of ARs, the sunspots exhibit proper as well as rotational motions, believed to be
associated with the storage of energy by increasing the magnetic non-potentiality and eventual
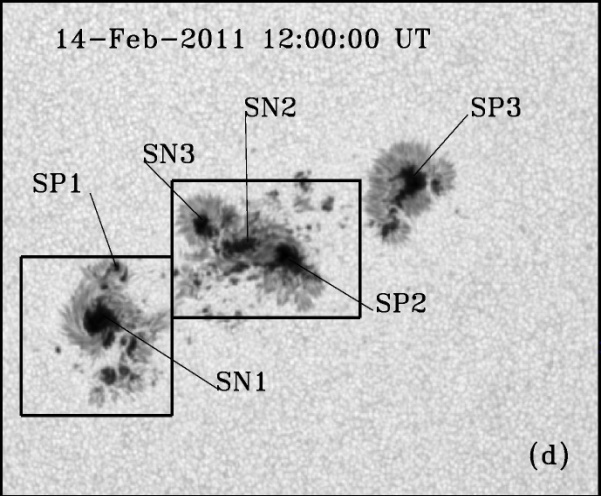
release in the form of observed eruptive events. We studied the rotating sunspots in AR 11158 and their probable role in the observed activity. Figure 2(a)
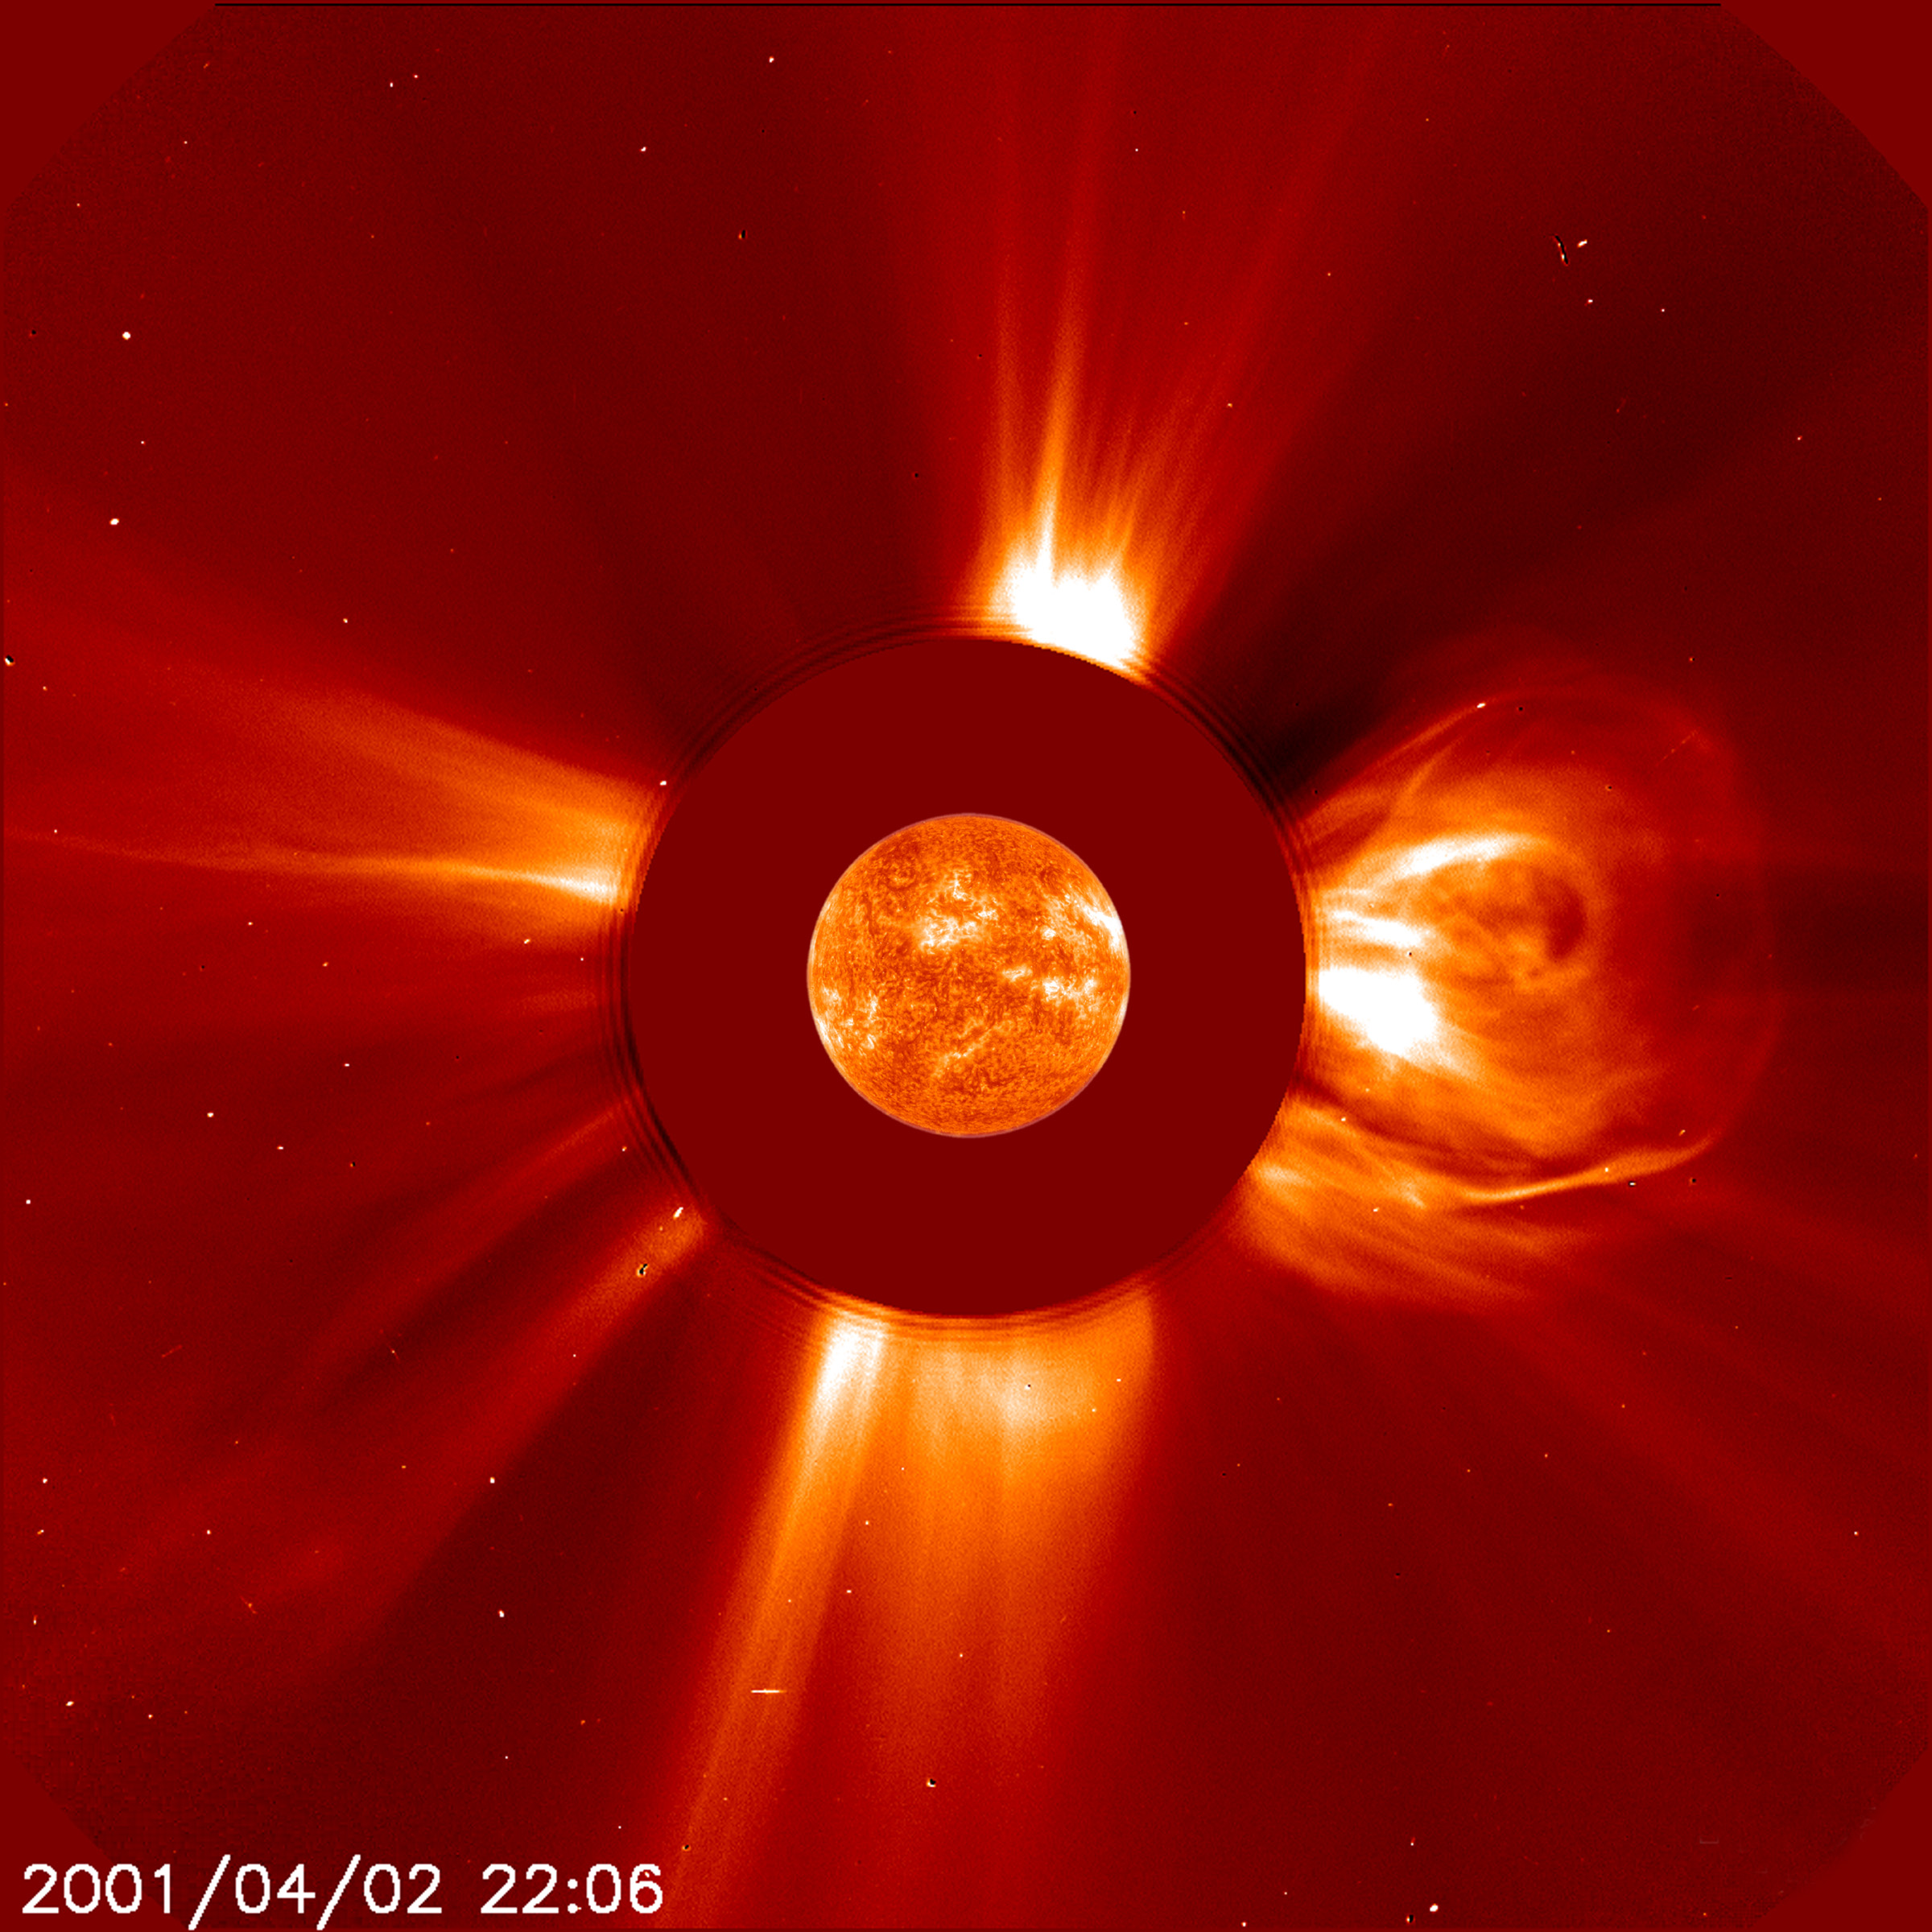
shows a huge coronal mass ejection pointed by arrow on February 14, 2011. The rectangular region in top-left panel
is shown in panel (top-right) in continuum intensity observed by Heliosiesmic Magnetic Imager with the labeled
sunspots. We have noticed intrinsic rotation of sunspots SN1 and SP1 by scrutinizing animations of these
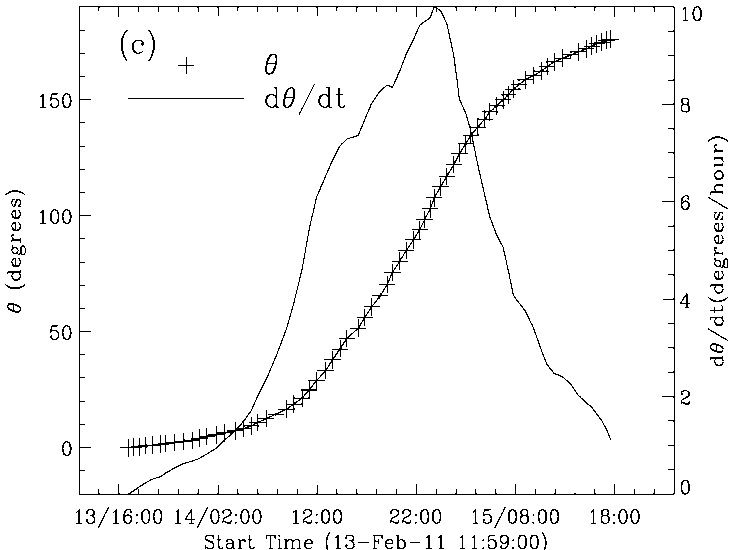
images. The sunspot SN1 is remapped to polar coordinate system to have the information about these rotational parameters
like angular distance (θ) and angular velocity (dθ/dt) with respect to time. In bottom-right panel, we have plotted
these parameters with respect to time, delineates that at maximum rotational speeds the CMEs occurred.
Figure 3 NOAA AR 11158 observed by (top-left) Atmospehric
Imaging Assembly aboard Solar Dynamic Observatory in 304Å channel showing CME pointed along the
arrow (top-right) in continuum intensity with labelled sunspots. SN1 and SP2 are observed to have intrinsic
rotational motion, (bottom-left) movie showing rotation of sunspot SN1, (bottom-right) Plot of the feature
displacement and angular velocity around the centroid with respect to time.
Note that the observed CME occurred when SP1 has maximum rotational velocity marked by arrow.
We further estimated various physical parameters representing non-potential nature as the AR evolves. The temporal profiles of twist parameters, namely, average shear angle, aav, abest, derived from HMI vector magnetograms, and the rate of helicity injection, obtained from the horizontal flux motions of HMI line-of-sight magnetograms, correspond well with the rotational profile of the sunspot in the CME-prone region, giving predominant evidence of rotational motion causing magnetic non-potentiality. Moreover, the mean value of free energy from the virial theorem calculated at the photospheric level shows a clear step-down decrease at the onset time of the flares revealing unambiguous evidence of energy release intermittently that is stored by flux emergence and/or motions in pre-flare phases. Additionally, distribution of helicity injection is homogeneous in the CME-prone region while in the flare-prone region it is not and often changes sign. This study provides a clear picture that both proper and rotational motions of the observed fluxes played significant roles in enhancing the magnetic non-potentiality of the AR by injecting helicity, twisting the magnetic fields and thereby increasing the free energy, leading to favourable conditions for the observed transient activity. [Ref: Vemareddy et al, 2012, Astrophys. J, 761, 60]
 |
 |
 |
 |
We further estimated various physical parameters representing non-potential nature as the AR evolves. The temporal profiles of twist parameters, namely, average shear angle, aav, abest, derived from HMI vector magnetograms, and the rate of helicity injection, obtained from the horizontal flux motions of HMI line-of-sight magnetograms, correspond well with the rotational profile of the sunspot in the CME-prone region, giving predominant evidence of rotational motion causing magnetic non-potentiality. Moreover, the mean value of free energy from the virial theorem calculated at the photospheric level shows a clear step-down decrease at the onset time of the flares revealing unambiguous evidence of energy release intermittently that is stored by flux emergence and/or motions in pre-flare phases. Additionally, distribution of helicity injection is homogeneous in the CME-prone region while in the flare-prone region it is not and often changes sign. This study provides a clear picture that both proper and rotational motions of the observed fluxes played significant roles in enhancing the magnetic non-potentiality of the AR by injecting helicity, twisting the magnetic fields and thereby increasing the free energy, leading to favourable conditions for the observed transient activity. [Ref: Vemareddy et al, 2012, Astrophys. J, 761, 60]
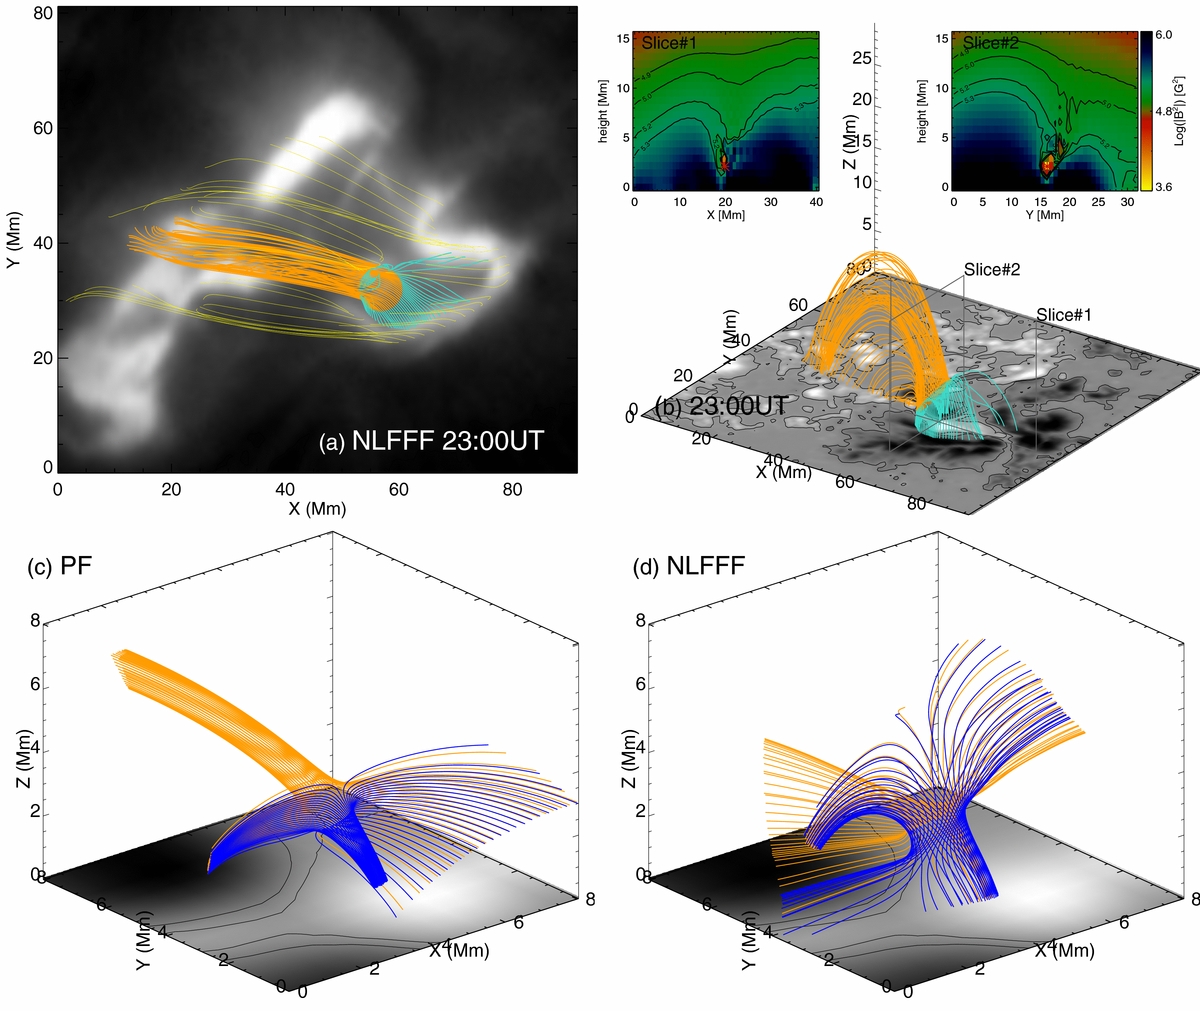
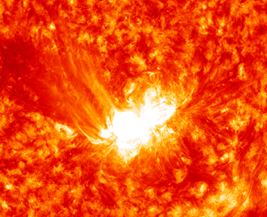
Using HMI magnetic field measurements as bottom boundary conditions, we modelled the coronal magnetic field of AR 11166 around the time of X1.5 flare occurence. The magnetic structure reveals a null point topology with dome-like fan saperatrix surface and tail-like spine connecting remote ribbons (Vemareddy & Wiegelmann 2014). Fan-separatrix surface intersects the photosphere along the observed flare ribbons. It suggests that the reconnection triggers at the pre-existing null point, from where particles impinge along field lines to form chromospheric flare ribbons.
Electric currents in the astrophysical plasmas are generated by distortion of the magnetic field by
external forces applied by field free plasma (Parker 1979). In the Sun, these currents enter the corona
through embedded emerging magnetic fields from the convection zone to the corona through the photosphere.
Despite their generation mechanisms, these currents are believed to play vital role in the magnetic solar
eruptions. However, the Parker's theoretical prediction (Parker 1996) of neutralized net vertical current
over a cross-section of flux tube at the photosphere is inconsistent to their role in eruptions. In many
studied ARs (Ravindra et al 2012, Georgoulis et al 2012, Vemareddy et al 2015), however the observance
of the non-neutralized net current is therefore needs proper explanation.
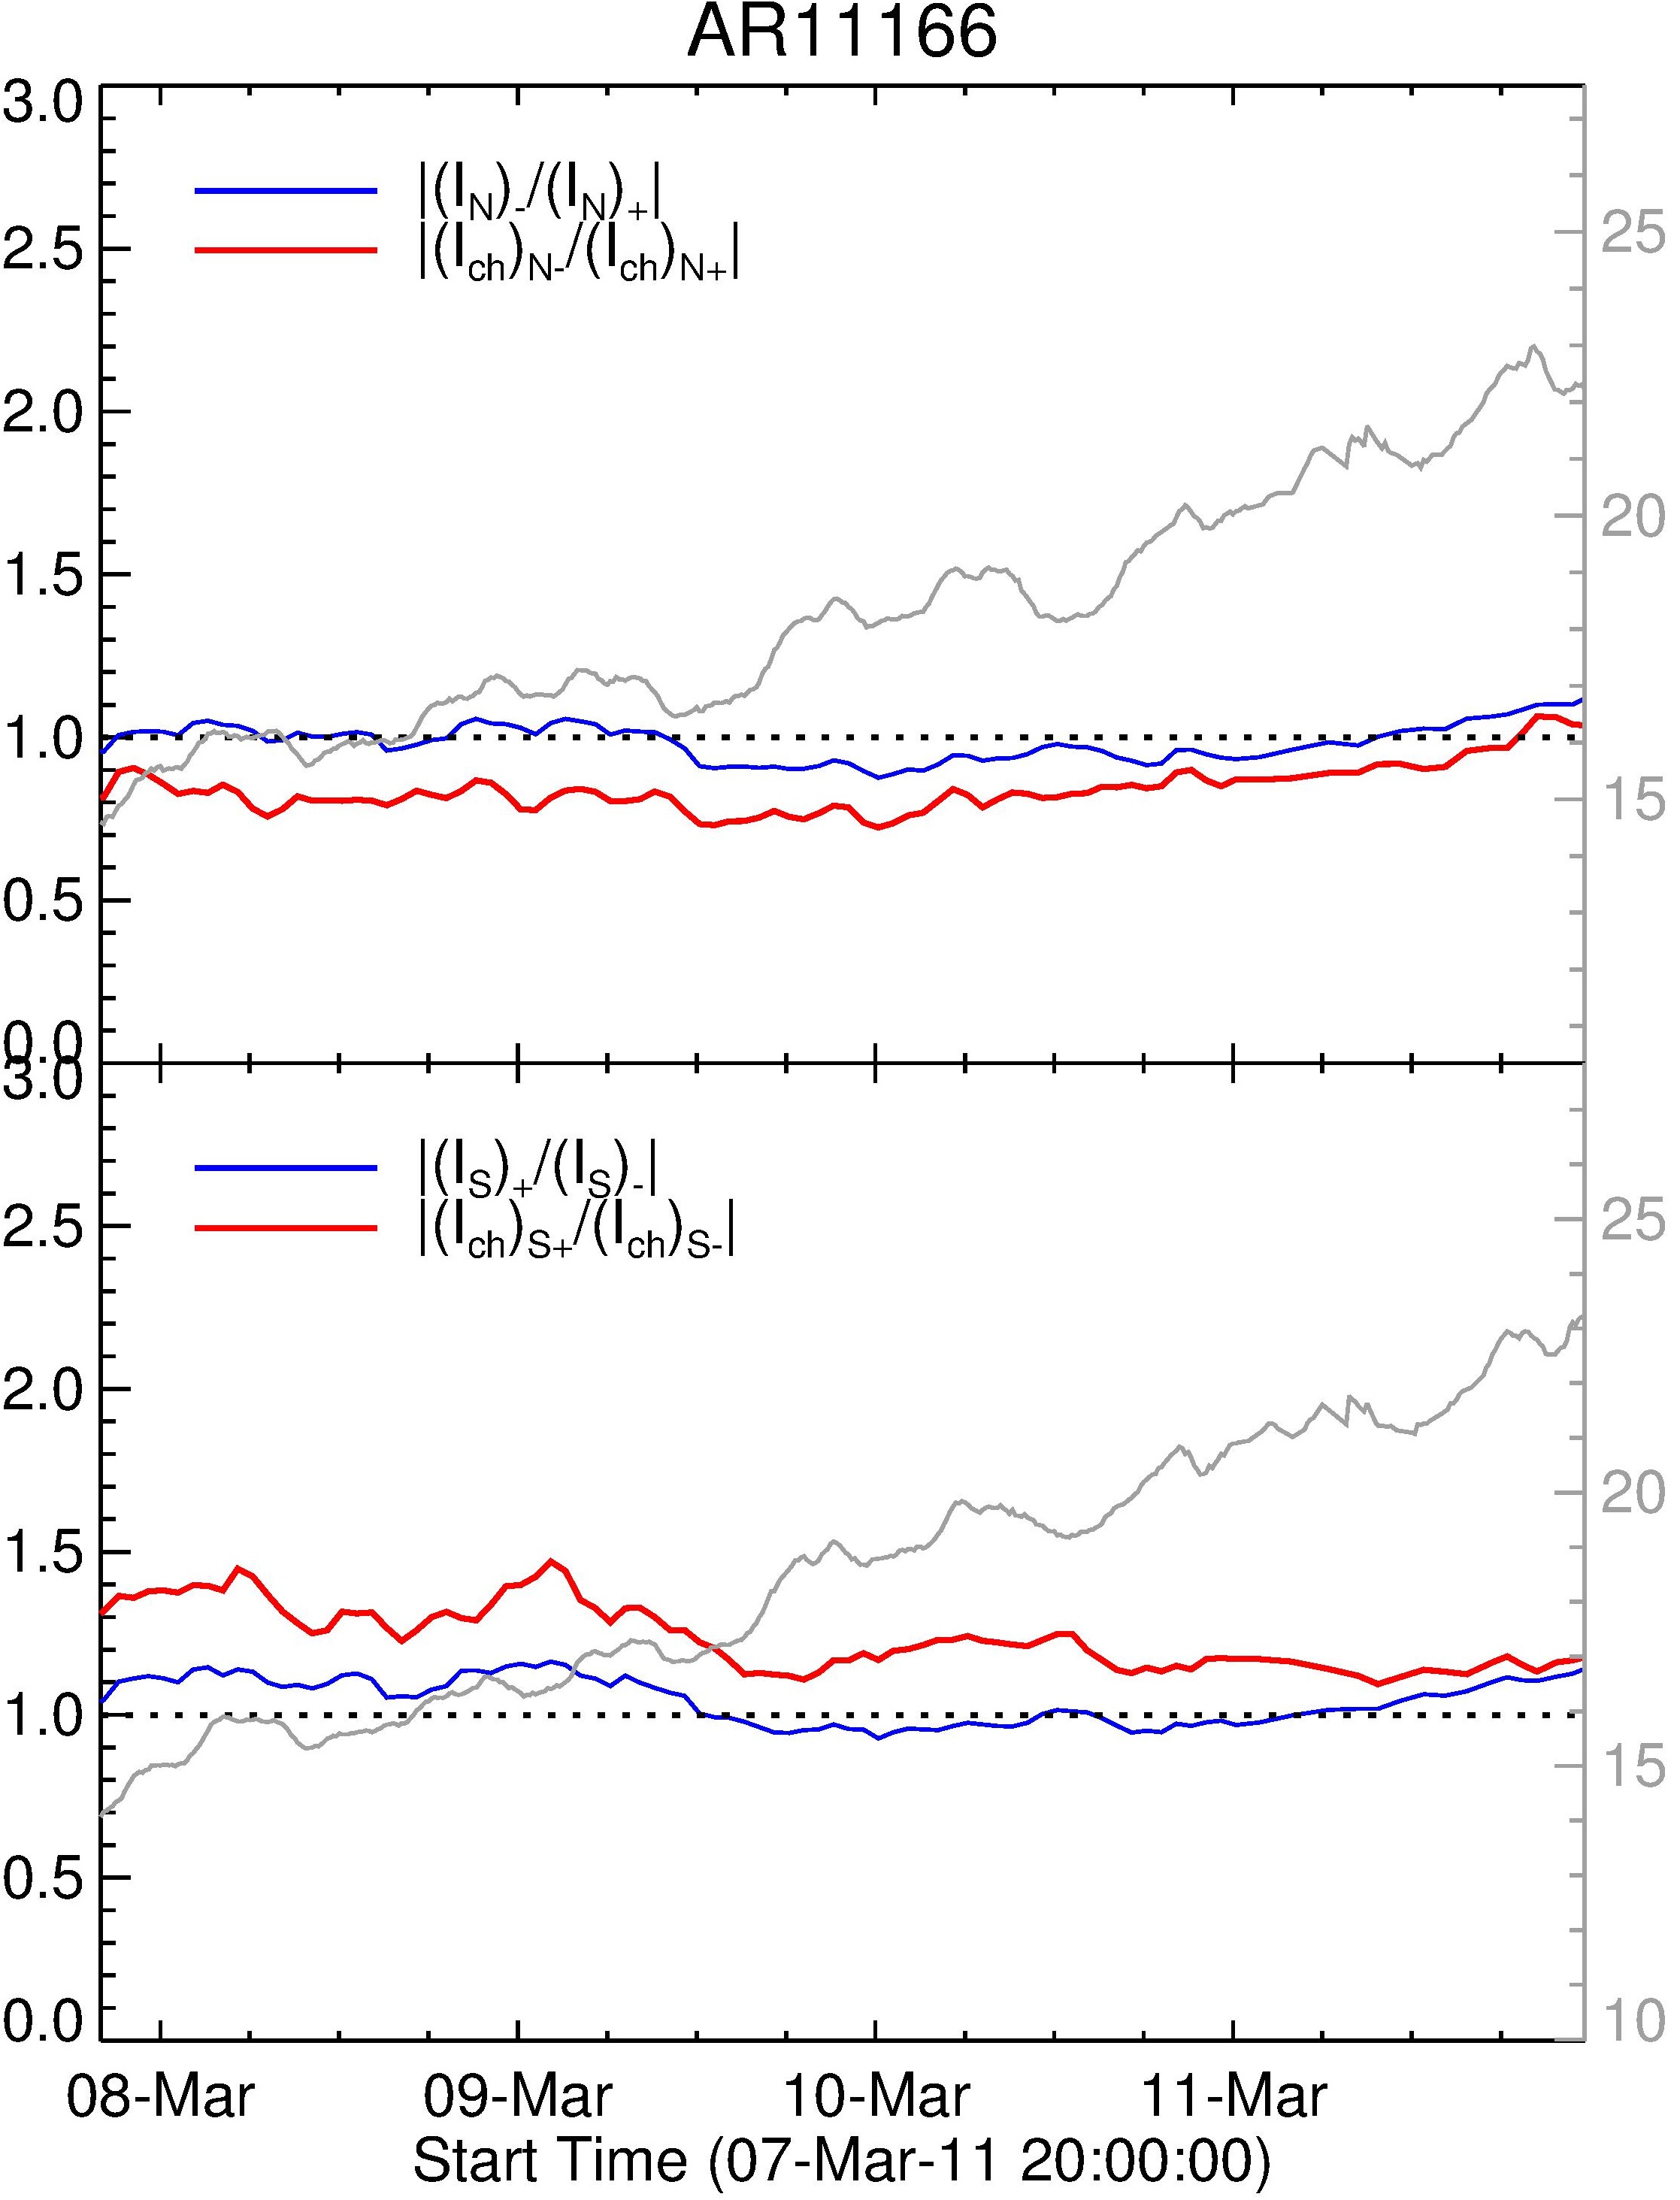
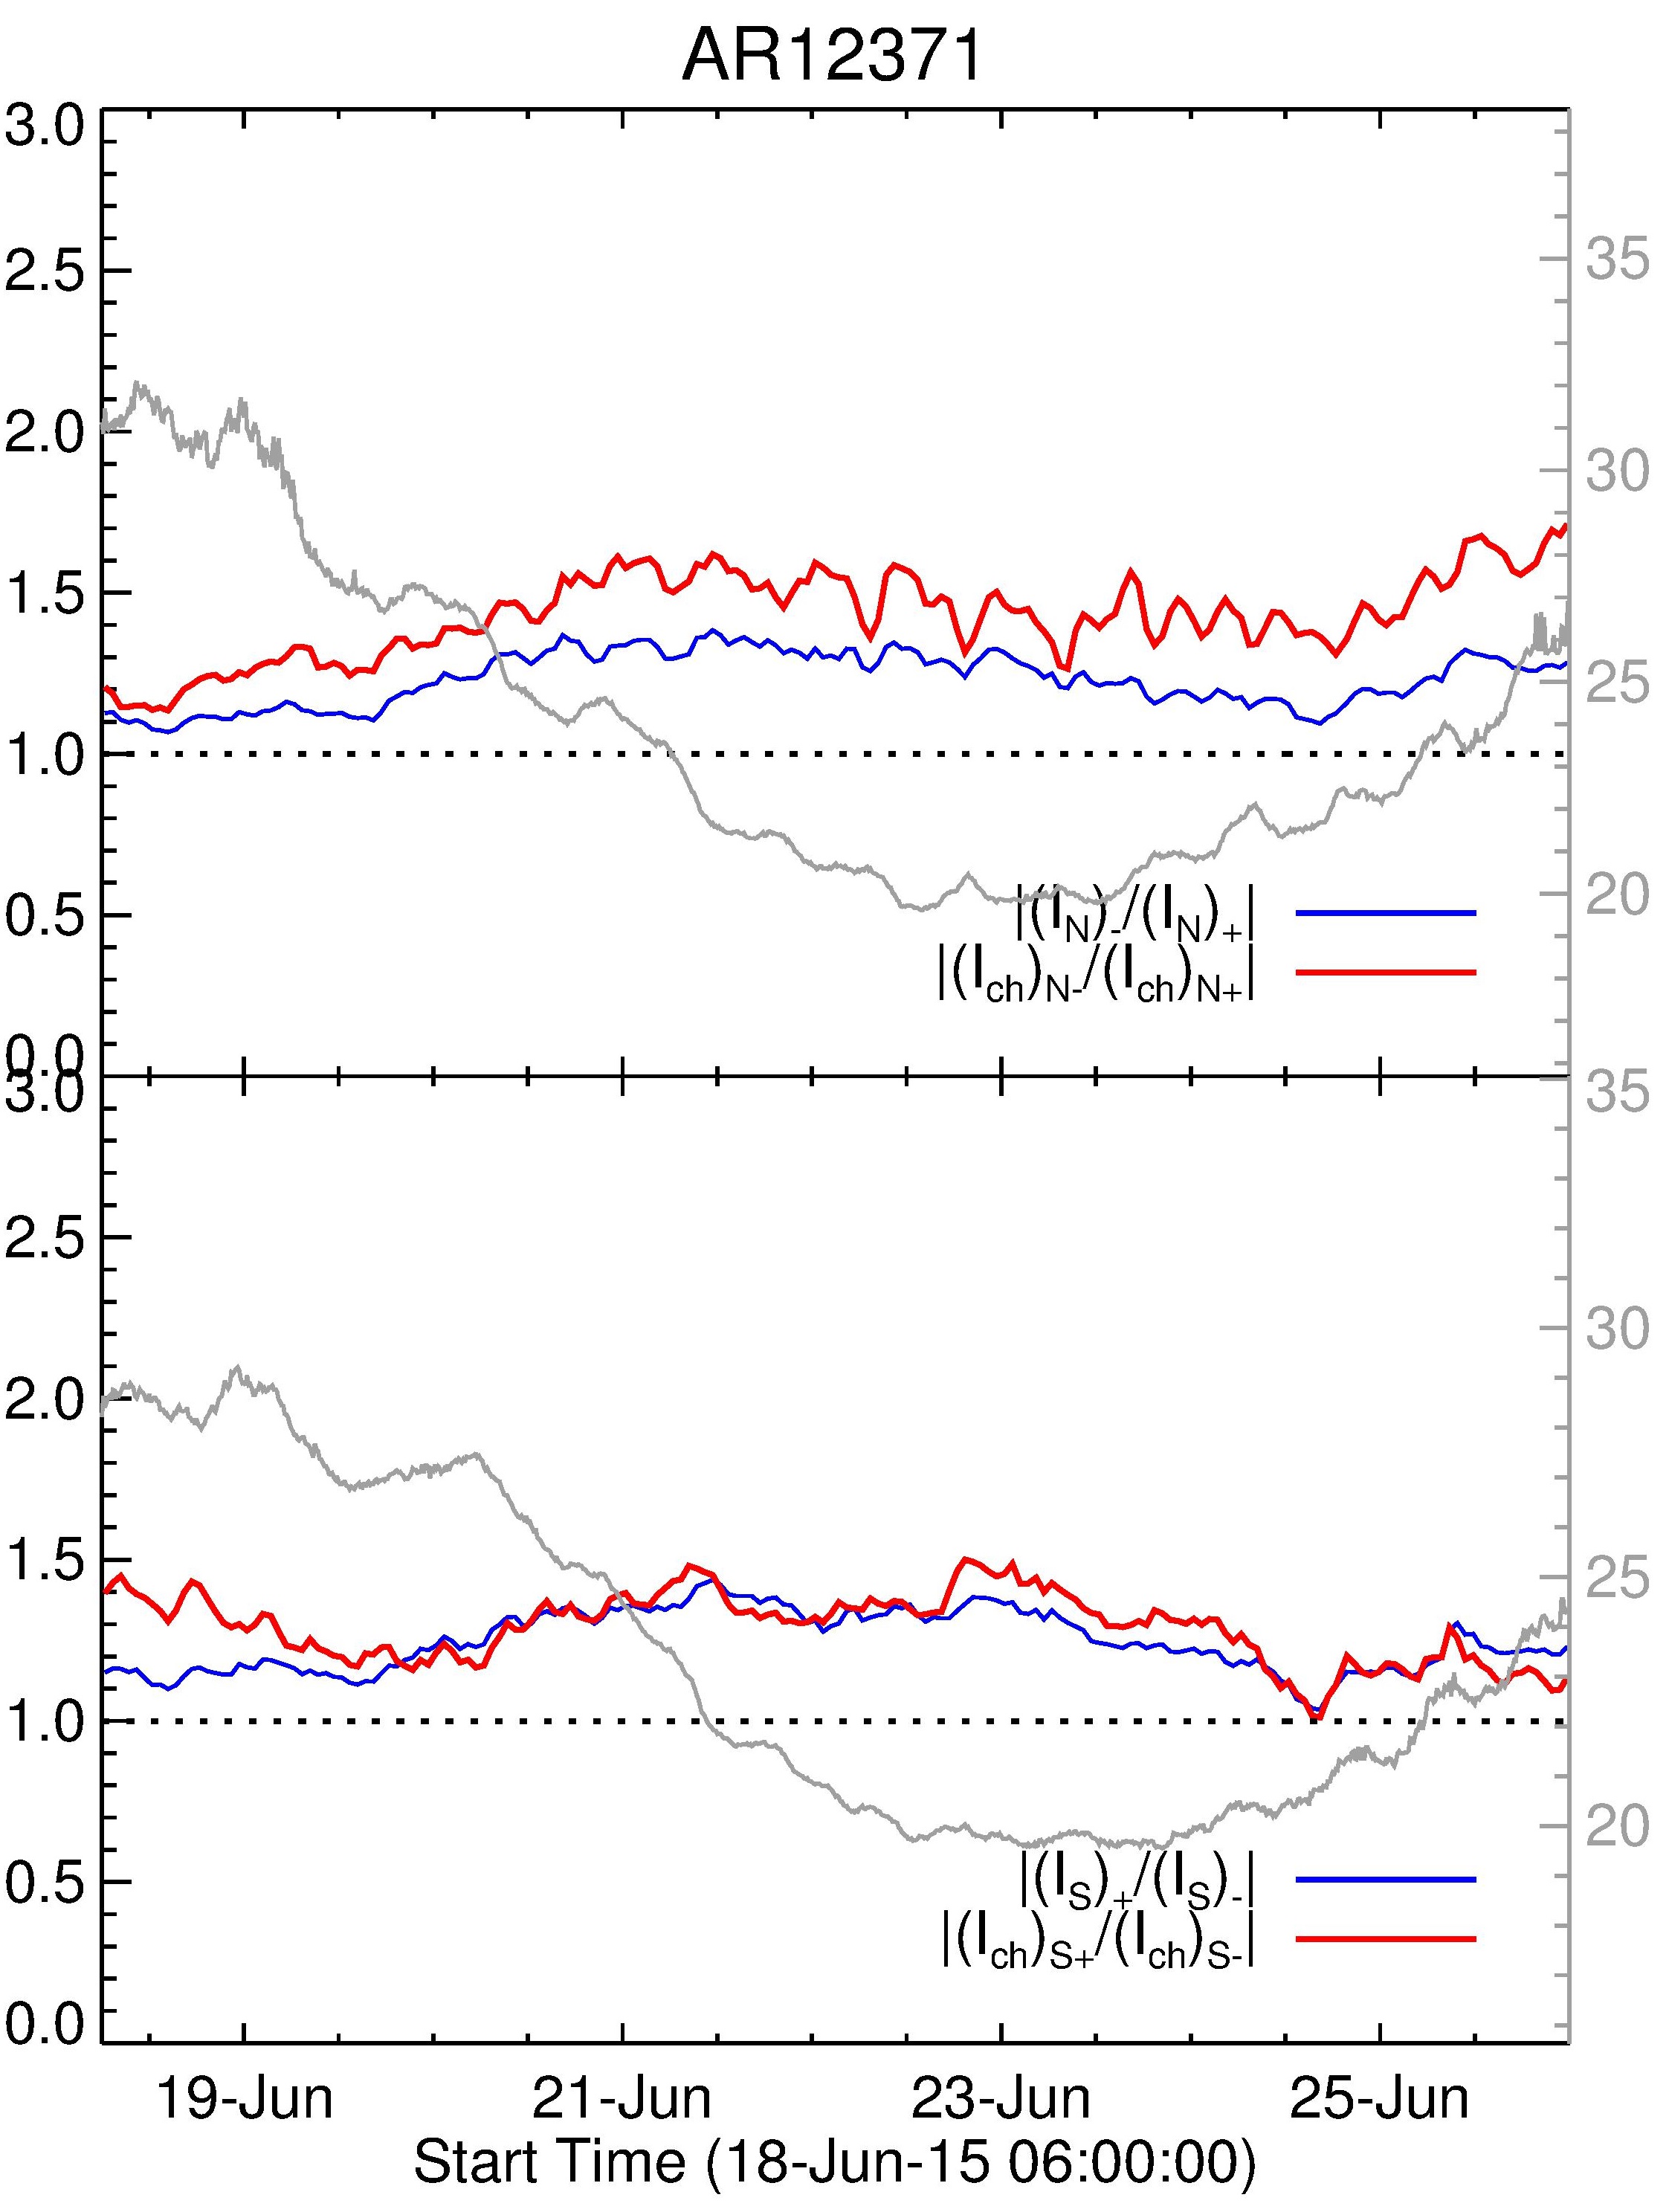
Figure 6 Evolution of |DC/RC| in north (Bz>0) and south (Bz<0) in AR 11166 and 12371.
The ratio is also plotted for twist current ($I_ch$) in respective panels. The net magnetic flux is
plotted in grey with y-axis scale on right of each panel. Horizontal dotted line marks current nuetralization
level of unity.
Breakdown of net current neutralisation has implications to CME activity from the AR. The hoop-force of CME flux
rope is proportional to square of the net current in the flux rope channel (Zakharov & Shafranov 1989), which is
the algebraic sum of net direct current (DC) and return current (RC). The equilibrium and stability
properties of the flux rope then requires the neutralisation of net current for which hoop force vanishes.
Numerical simulations showed that a major breakdown occurs during emerging phase of AR (Torok et al 2014),
during which opposite polarity regions are compact with a sheared PIL. Observational studies also found
that the sheared PIL is the major contributor to DC and proposed the degree of current-neutralisation as
the proxy for assessing the ability of ARs to produce CMEs (Liu et al 2017).
Using HMI photospheric vector magnetic field, we can only measure vertical component of electric current from Ampere's Law. In Figure 6, we plot the ratio of |DC/RC| (blue) in both polarities of flaring-only AR 11166 and CME-rich AR 12371. The evolution of this ratio is well above unity due to highly non-neutralized current in AR12371, whereas it is near unity indicating nearly neutralized currents in AR 11166. The red curve is the |DC/RC| for twist current, which follows above that of net current (blue). This is due to the fact first found in Vemareddy (2017) that the twist current is opposite in sign dominantly to that of shear current, which comes from gradient of field strength. From a study of 20 ARs of different activity, we conclude that the non-neutralised currents arise from sheared polarity inversion lines, whose segmented nature links to the flare/CME activity in the AR. (Ref: Vemareddy 2019, MNRAS)
 |
 |
Using HMI photospheric vector magnetic field, we can only measure vertical component of electric current from Ampere's Law. In Figure 6, we plot the ratio of |DC/RC| (blue) in both polarities of flaring-only AR 11166 and CME-rich AR 12371. The evolution of this ratio is well above unity due to highly non-neutralized current in AR12371, whereas it is near unity indicating nearly neutralized currents in AR 11166. The red curve is the |DC/RC| for twist current, which follows above that of net current (blue). This is due to the fact first found in Vemareddy (2017) that the twist current is opposite in sign dominantly to that of shear current, which comes from gradient of field strength. From a study of 20 ARs of different activity, we conclude that the non-neutralised currents arise from sheared polarity inversion lines, whose segmented nature links to the flare/CME activity in the AR. (Ref: Vemareddy 2019, MNRAS)
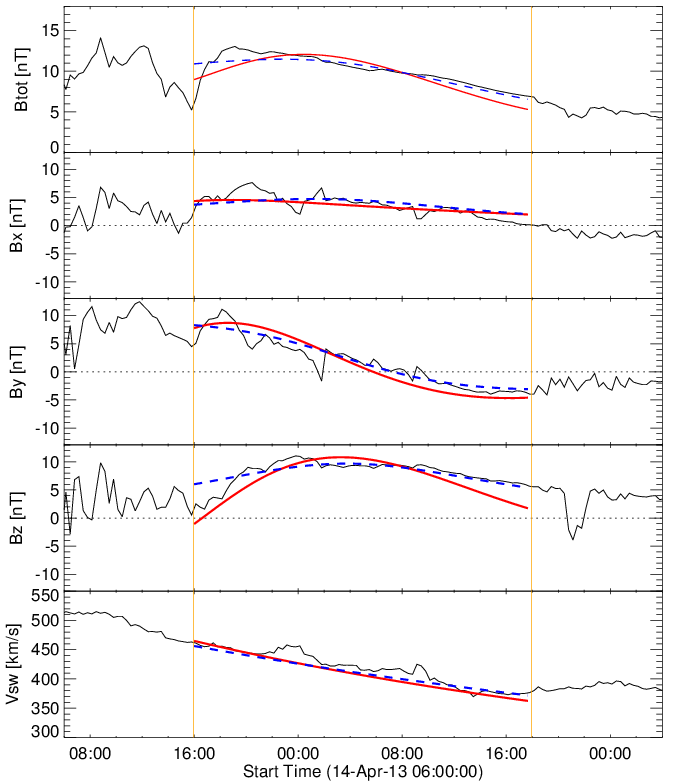
A MC passage through the space-craft in in-situ is generally identified by a strong magnetic field strength, low plasma beta, and rotation of any magnetic field component (reversal of sign during passage). In the flux rope scenario, cylindrically symmetric force-free models fit the in-situ MC observations well (see Figure 12). Since the direction of axial component (southward/northward) in MC decides the occurence of geo-magnetic storms, it is crucial to determine the orientation of the flux rope and its axial field polarity.
In the above flux rope scenario, MC magnetic field observations are fitted (Figure 4) with Cylindrically symmetric constant linear force-free Lundquist model (solid red) and non-linear force-free Gold-Hoyle (dashed blue) models. A recent study (Vemareddy et al 2016) found that Gold-Hoyle models best fits the observations, in terms of chisquare, especially when MC expansion is accounded in the model.
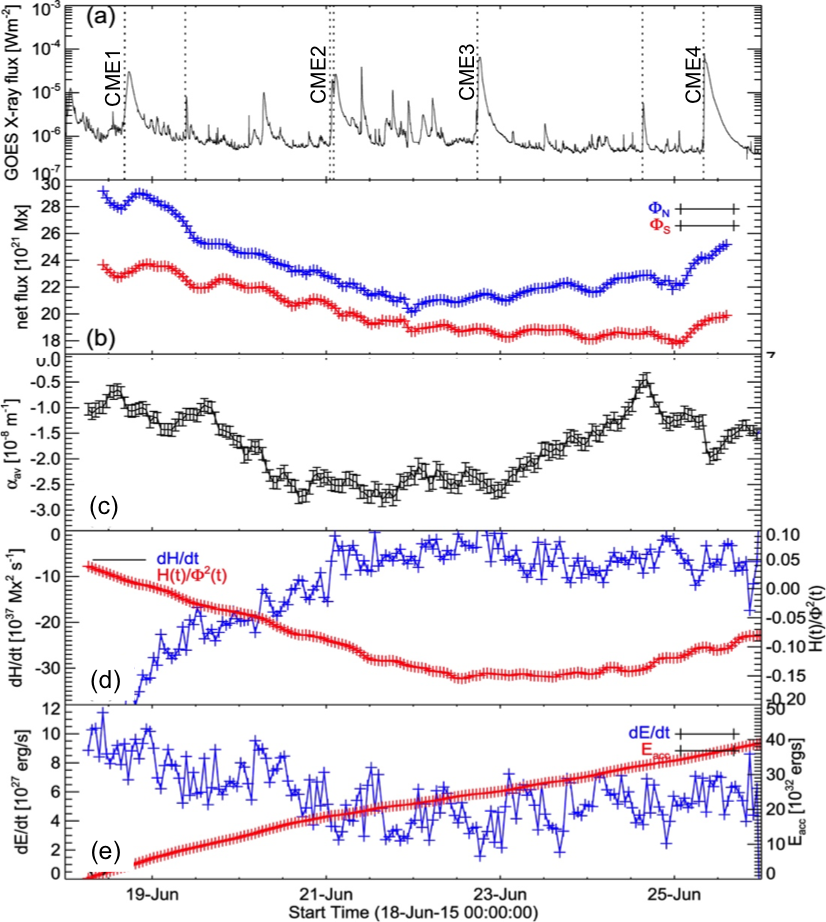
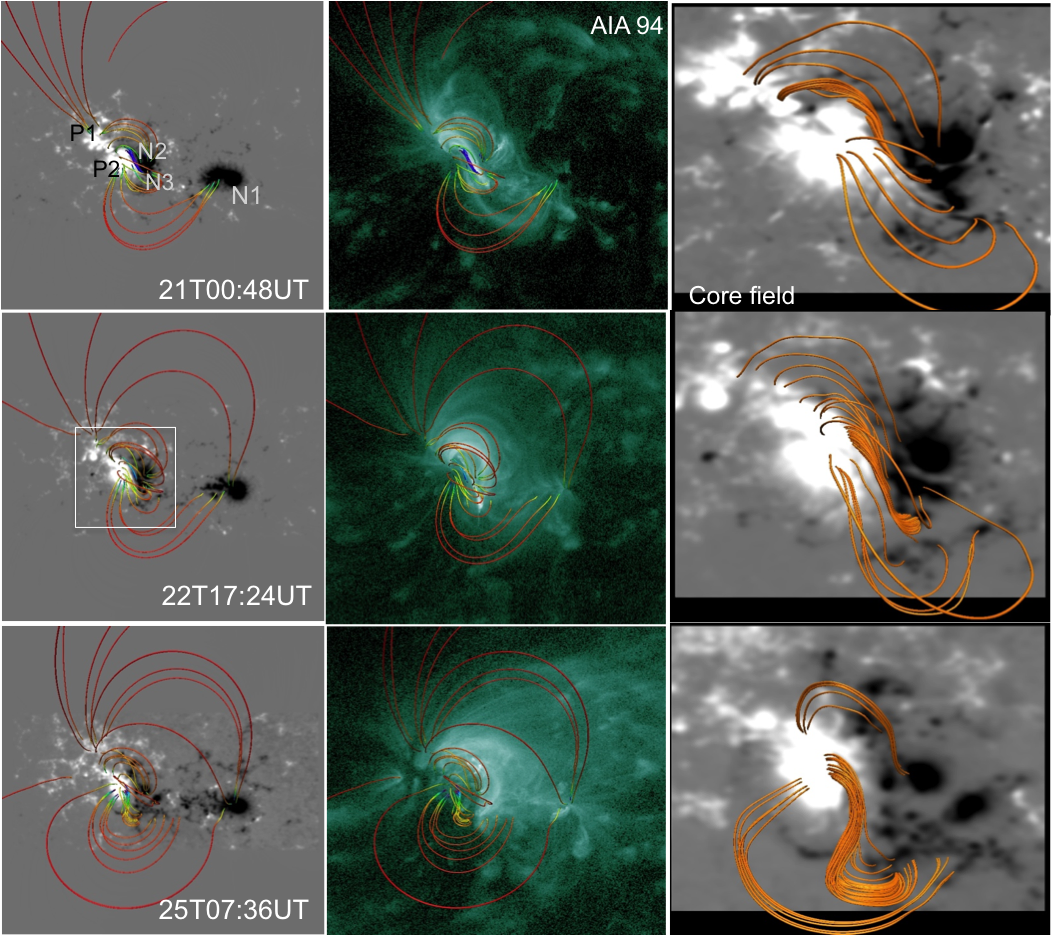
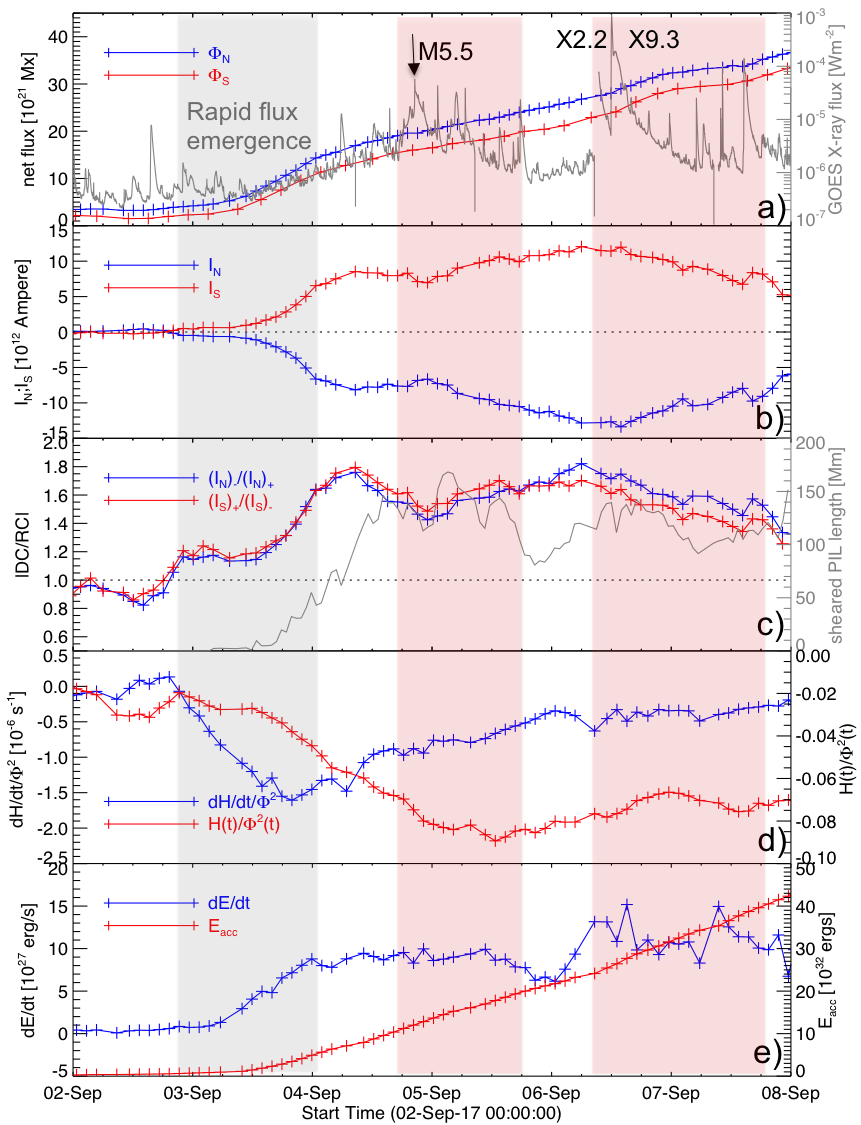
AR 12371 is in post-emerged phase producing successive fast CMEs in a span of its disk transit (18-25 June, 2015). EUV observations at the Sun register the initiation times of four eruptions as 15:05UT on 18 (CME1), 00:45UT on 21 (CME2), 16:15UT on 22 (CME3), and 07:30UT on 25 (CME4) of June 2015, respectively. Subsequently, the disk integrated GOES X-ray light curve (Figure 6a) delineates that the CMEs are associated with long duration M-class flares. The EUV double dimming, three-part CME structure, and fast propagation speeds in LASCO FOV (>1000kms-1) altogether characterize the CMEs as homologous events.
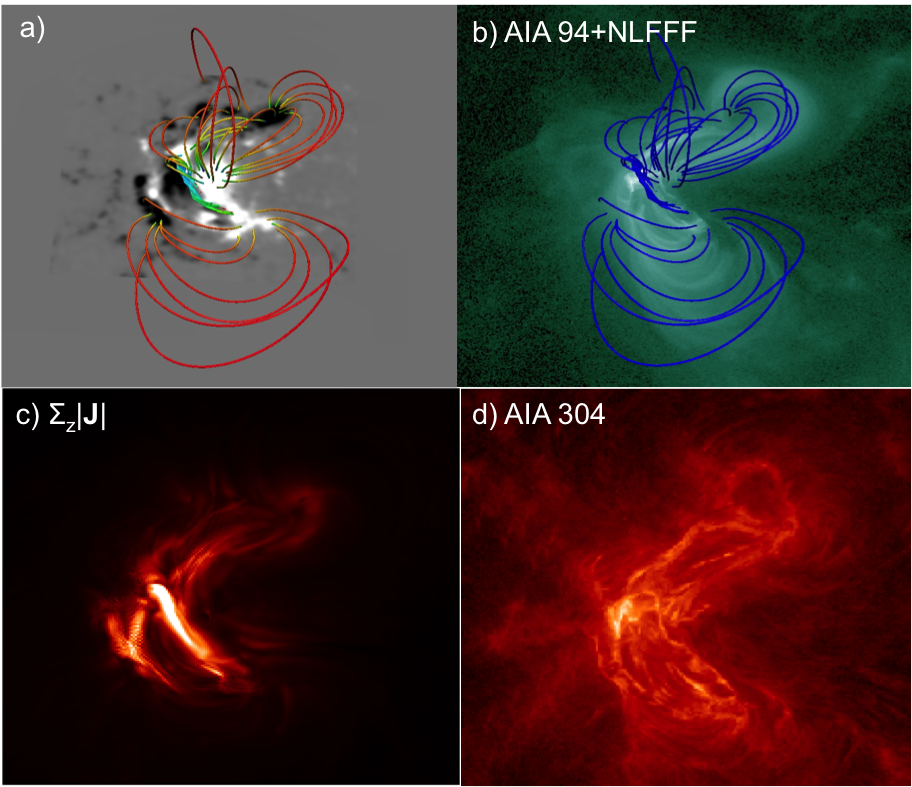
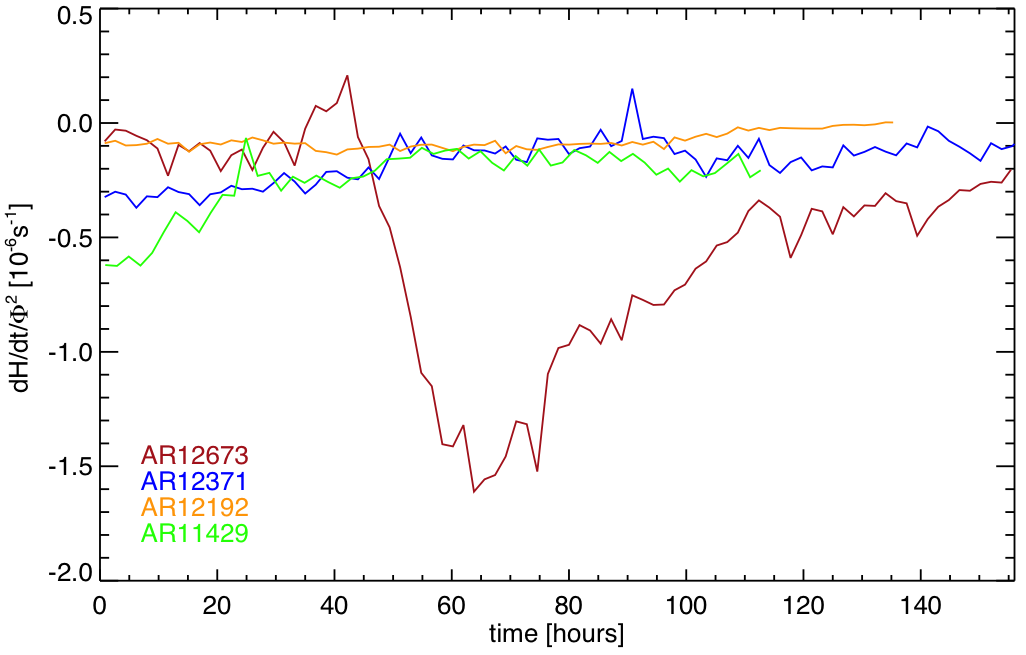
The magnetic evolution in this AR is summarised in Figure 6. The region of sigmoid is seen with persistent shearing and converging motions of opposite magnetic polarities over 7-days of evolution. At the same time, the net flux decreases over time (24%) with the build-up of magnetic twist (till 22nd June). The helicity flux, derived from footpoint motions, is negative and co-spatial with the coronal sigmoid. This implies qualitatively that the pumped helicity flux is being utilised in the repeated build-up of sheared core along the polarity inversion line. Besides injection helicity flux, the energy flux injection by flux motions is above 5x1027 ergs/s, which amounts to that required by a fast CME (~1033ergs) over about 50hours. Importantly, the normalised helicity flux is moderately high (0.15turns) compared to non-eruptive super AR 12192 (0.02 turns). A high value of magnetic flux normalized helicity flux typically suggests presence of a coherent twisted field.