Comet C/2012 (ISON)
In January 2013 IIA high-altitude balloon group (Nayak et al. 2013) has initiated observations of the comet C/2012 (ISON) in preparation for the November 2013 launch of the UV spectrograph to observe this comet at the time of its perihelion nearUV window (200400 nm). This comet is thought to be pristine, on its first journey into the inner Solar System and, as such, its chemical composition reflects the nature of the original interstellar cloud from which the Solar system was formed. Some objectives of the UV spectrograph on our high-altitude balloon flight are to observe lines of hydroxyl radical (OH) at 308 nm and other important molecular fragmentscyanide (CN), carbon monosulfide (CS) and diatomic and triatomic carbon (C2 and C3). In addition, the continuum spectrum of comets below 300 nm has rarely been studied. Till date, we have observed the comet in January, February, May, September and October 2013 both in imaging and spectroscopic mode using HCT and VBT telescopes. Below we present some results of our HCT imaging observations.
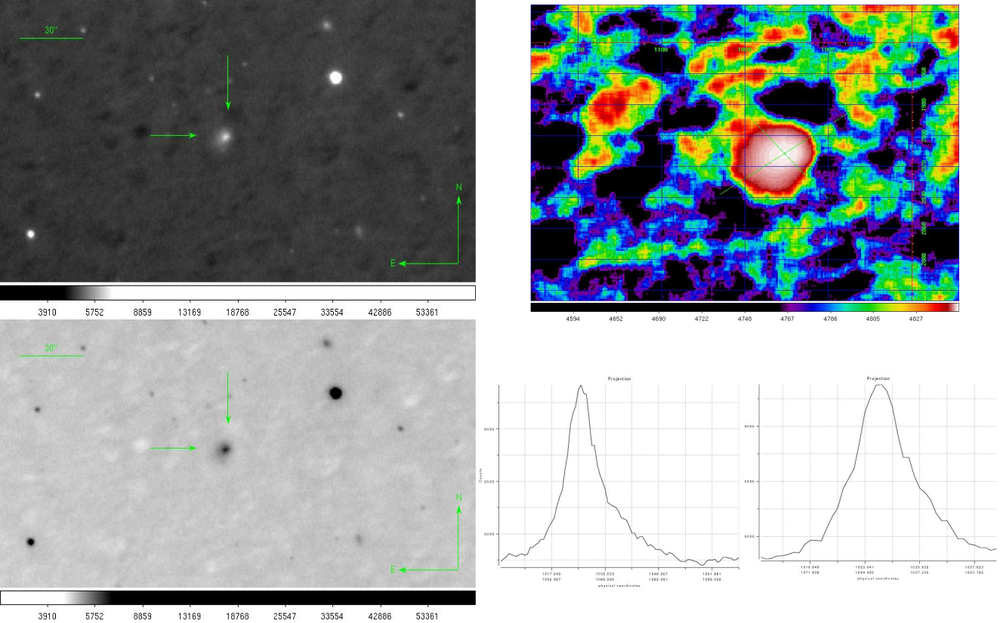
Fig.1: Comet C/2012 (ISON) 2013 January 22 13:47:40.00UT, 200 sec, I band single exposure. Observers: Margarita Safonova, A.G.Sreejith and Pramod Kumar. Left panels: Comet ISON marked by green arrows. Right top panel: comet closeup in false colours; projections done through the comet's `nucleus' – the brightest part of the coma along the tail and across. Below the the corresponding graphs: on the left seen the sharp rise and longer fall indicating the tail; on the right graph the curve is more symmetric (across the `nucleus'). It must be mentioned here that the real nucleus of the comet cannot be resolved at this distance, it is of the order 5100 km; what we see is the brightest part of the coma. Distance to the comet is 4.09 AU, where 30” is equal to 88,996 km.
Fig.2: Comet C/2012 (ISON) 2013 February 22 18:55:54.00UT, 150 sec, R band single exposure. Observers: Margarita Safonova, Joice Mathew, Shripathy Hadigal and Pramod Kumar. Left panels: Comet ISON. Right top panel: comet closeup in false colours to enhance the 'nucleus'; projections done through the comet's 'nucleus' along the tail and across the 'nucleus'. Below the the corresponding graphs: on the left graph the asymmetry is more pronounced as the tail grows; on the right graph the curve is more symmetric. Distance to the comet is 4.033 AU, where 30” is equal to 87,333 km.
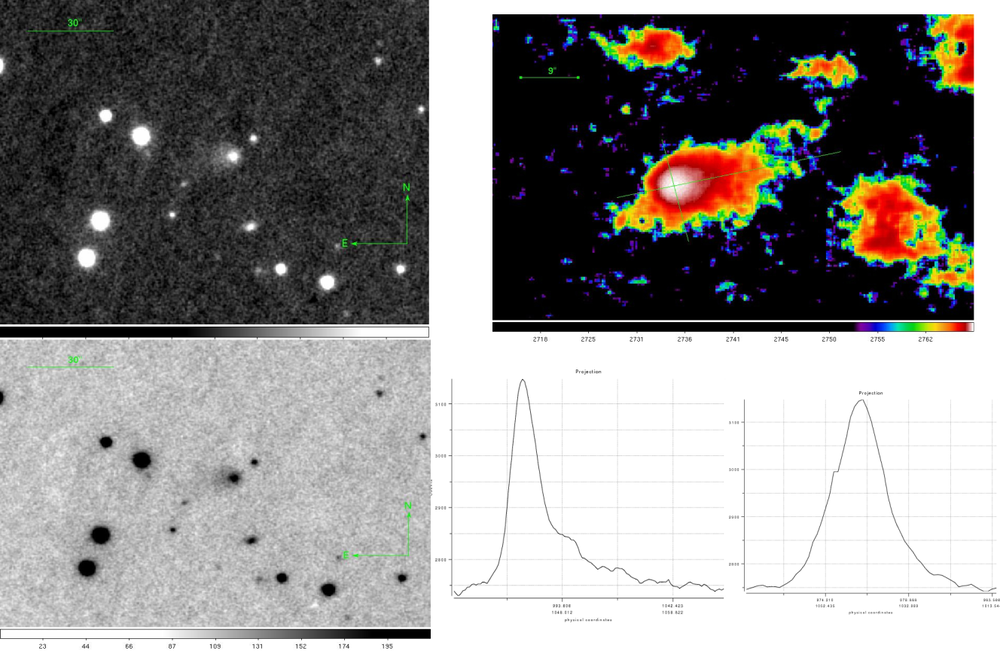
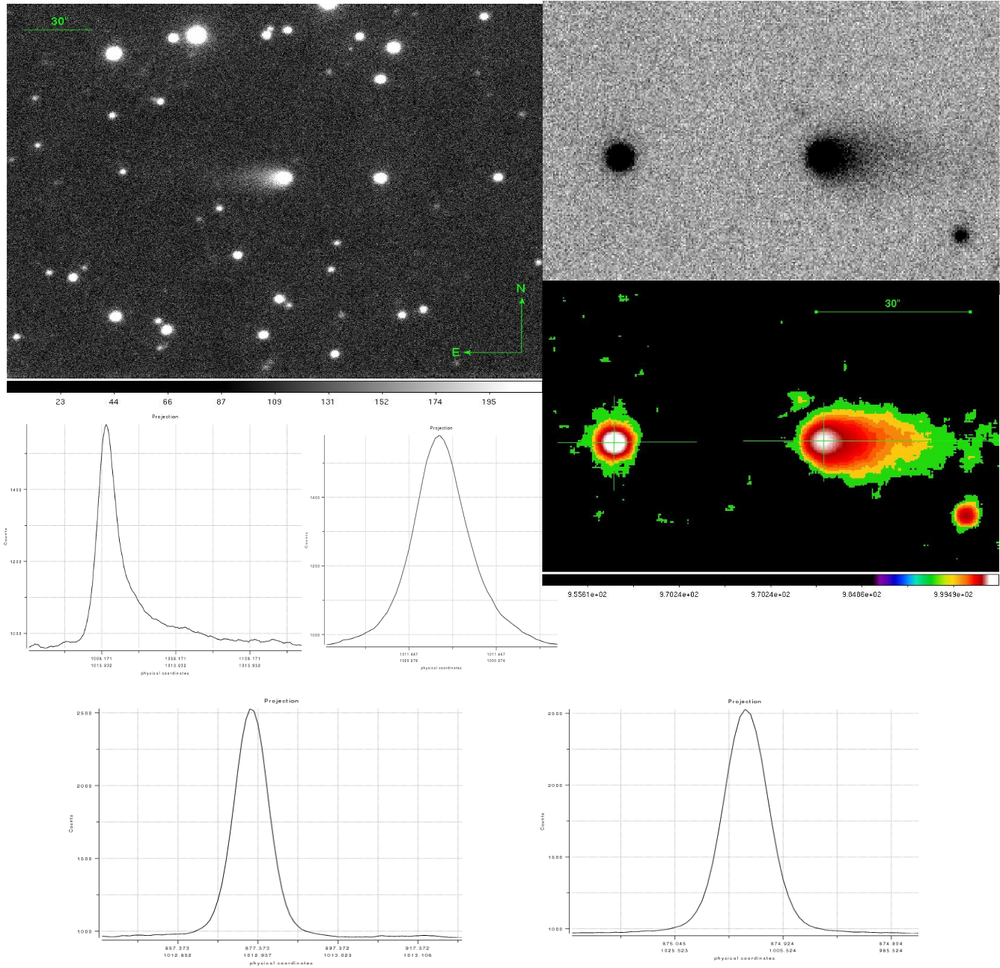
Fig.3: Comet C/2012 (ISON) 2013 May 01 14:14:04.00UT, 240 sec, V band single exposure. Observers: Firoza Sutaria, Joice Mathew, Shripathy Hadigal and Pramod Kumar. Left panel: Comet ISON. Right top panel: comet closeup inverted (top) and in false colours (bottom) to enhance the 'nucleus'; projections done through the comet's 'nucleus' along the tail and across the 'nucleus'. The corresponding graphs: on top are the comet's projections (left: through the tail, right: across the 'nucleus'); below are the same orientation projections for the neighbouring star to illustrate the stellar symmetric profile. Distance to the comet is 4.324 AU, where 30” is equal to 94,080 km.
Fig.4: Comet C/2012 (ISON) 2013 September 08 23:11:45.00UT, 200 sec, I band single exposure. Observers: Margarita Safonova, Joice Mathew and Pramod Kumar. Left panel: Comet ISON. Left panels: Comet ISON. Right top panel: comet closeup in false colours to enhance the central part; projections done through the comet's 'nucleus' along the tail and across the 'nucleus'. Right bottom panel: the contour plot of coma. Below the the corresponding graphs: left graph shows the very pronounced sharp rise at the 'nucleus' and long fall along the tail; in the right graph the curve is more symmetric. These observations were performed in the Keystone mode of the HCT, where minutebyminute ephemeris of the object are provided beforehand, so that the object is tracked throughout the exposure. In this mode, the object stays in the centre of the field, while the stars will be trailed. The Keystone mode compatible files have been generated according to the format given by Angchuk Dorje by Firoza Sutaria from the JPL ephemeris data for the comet. Distance to the comet is 2.792 AU, where 30” is equal to 60,748 km.
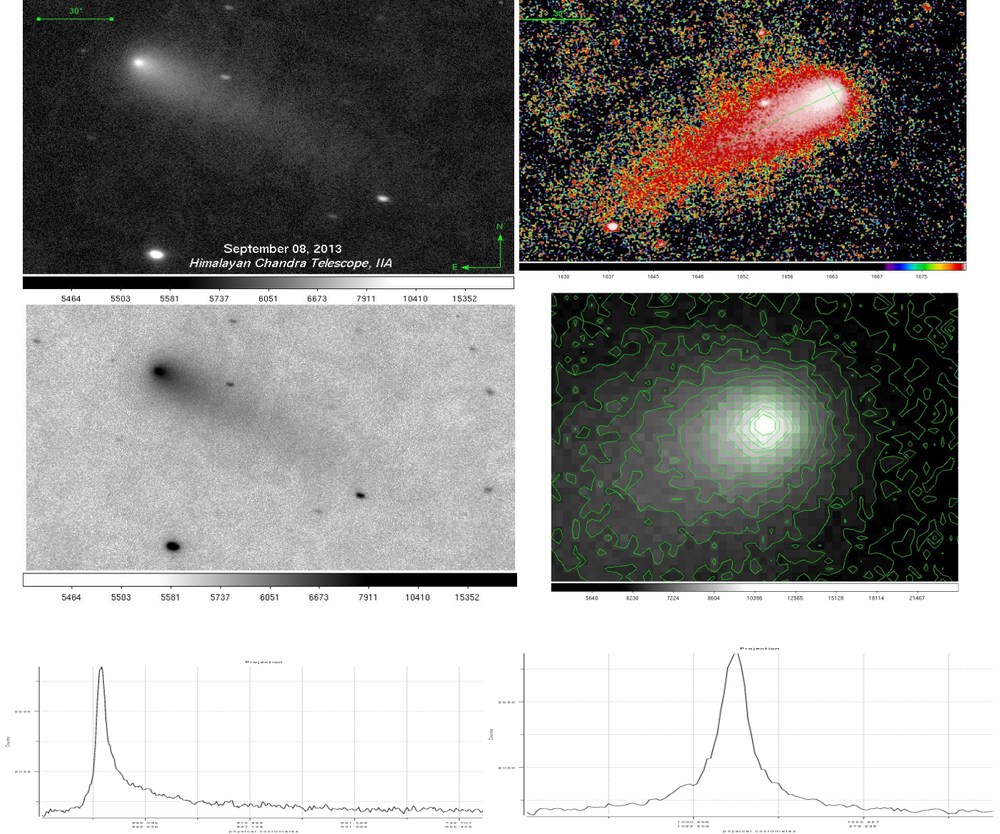
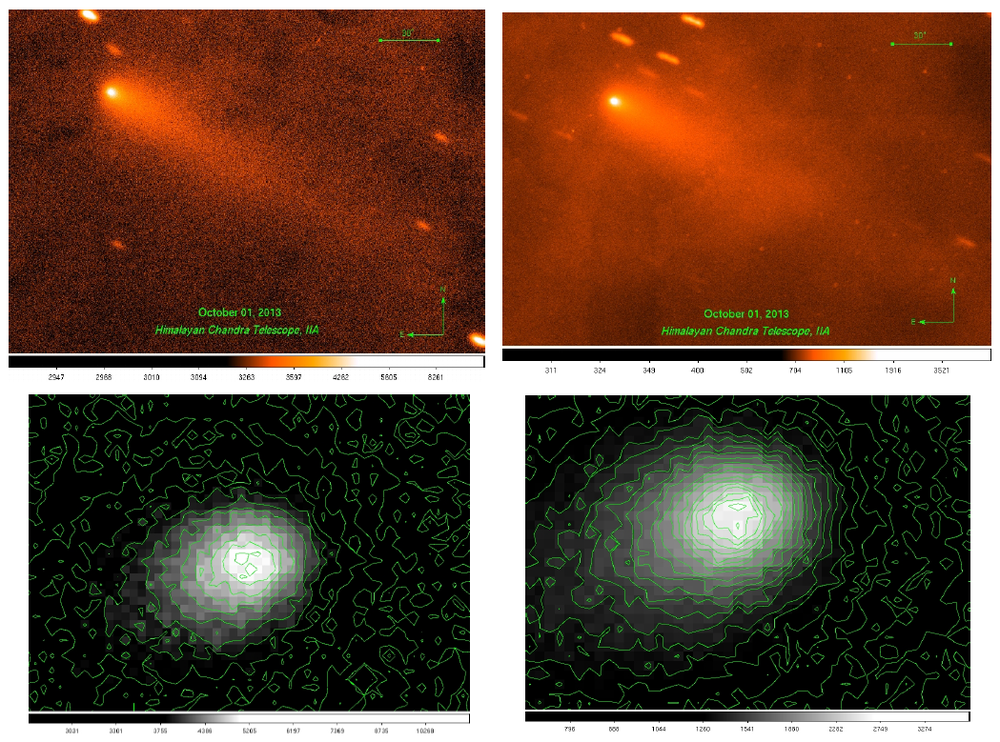
Fig.5: Comet C/2012 (ISON) 2013 October 01. Observers: Margarita Safonova and Pramod Kumar. Top images: on the left is 300 sec, R band single exposure, on the right is B band combined exposure (600 sec and 900 sec). The observations were performed in the Keystone mode of the HCT. The images are in colour to emphasize the difference between the dust coma and tail (R filter) and gas coma (B filter). In B the ion tail should be more visible, but here it is still small compared to the dust tail (R filter); the coma, however, is visibly larger. Distance to the comet is 2.151 AU, where 30” is equal to 46,790 km.
Bottom panels: the contour plots of central part of the coma. Left image: 300 sec R frame, right image: 900 sec B frame. The contour plots show several isolated bright spots, which may be an indication of the comet's breaking down as proposed by Ferrin (2013). For comparison, the September contours do not show fragmentation.
The data presented here is part of the paper by Samarasihna et al. 2015.
References:
- Nayak, A., Sreejith, A. G., Safonova, M. and Murthy, J. “High-Altitude Ballooning Program at the Indian Institute of Astrophysics”, 2013, Current Science, Vol. 104, No. 6, pp. 708713.
- Ferrin, I. “ The Impending Demise of Comet C/2012 S1 ISON”, 2013, arXiv:1310.0552.
- Samarasihna, N, H., ..., Safonova, M., Murthy, J., Sutaria, F., et al. , 2015. Results from the worldwide coma morphology campaign for comet ISON (C/2012 S1). Planetary and Space Science, 118, 127-137. https://doi.org/10.1016/j.pss.2015.10.006.