Comet C/2021 (also called Comet Leonard)
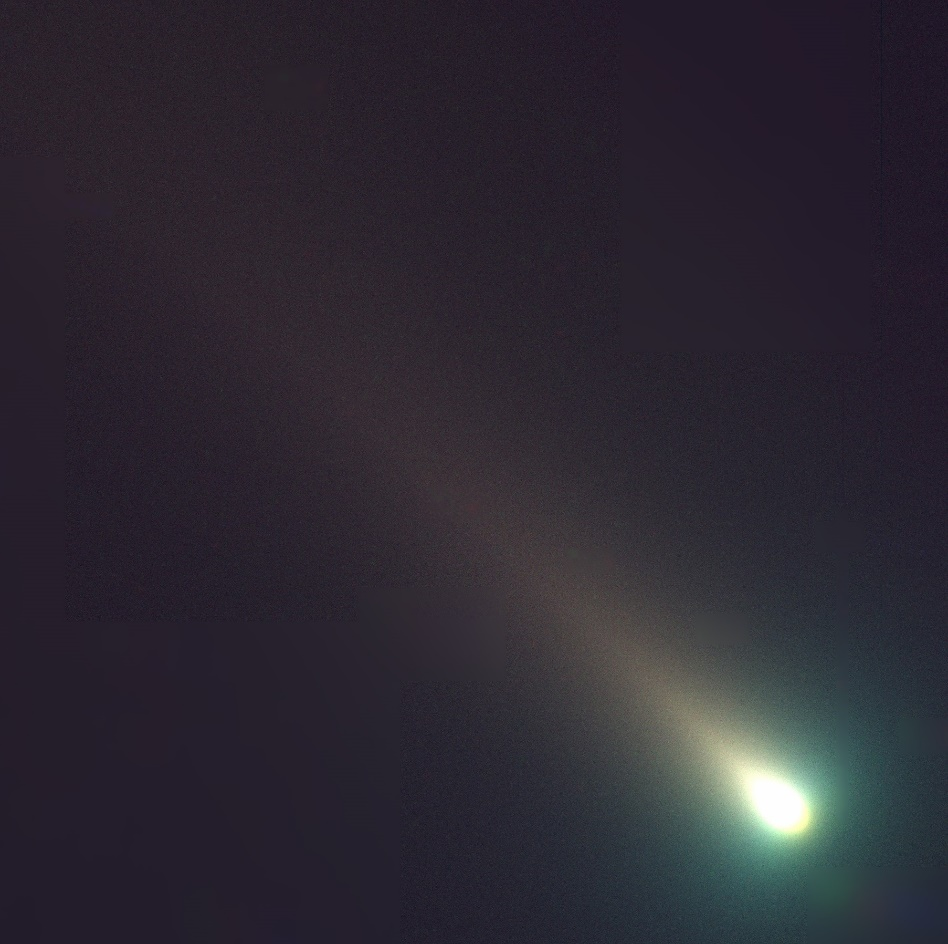
Comet C/2021 A1, now known as Comet Leonard, was discovered in January 2021 by a researcher Greg Leonard. It has a hyperbolic orbit and its journey here from deep space is estimated to have taken about 35,000 years. It will pass near Earth around Dec. 14, when it may be visible with binoculars or possibly even without them. We observed it on Nov. 25 with the HCT (IIA, Hanle) and estimate its brightness as 8th magnitude.
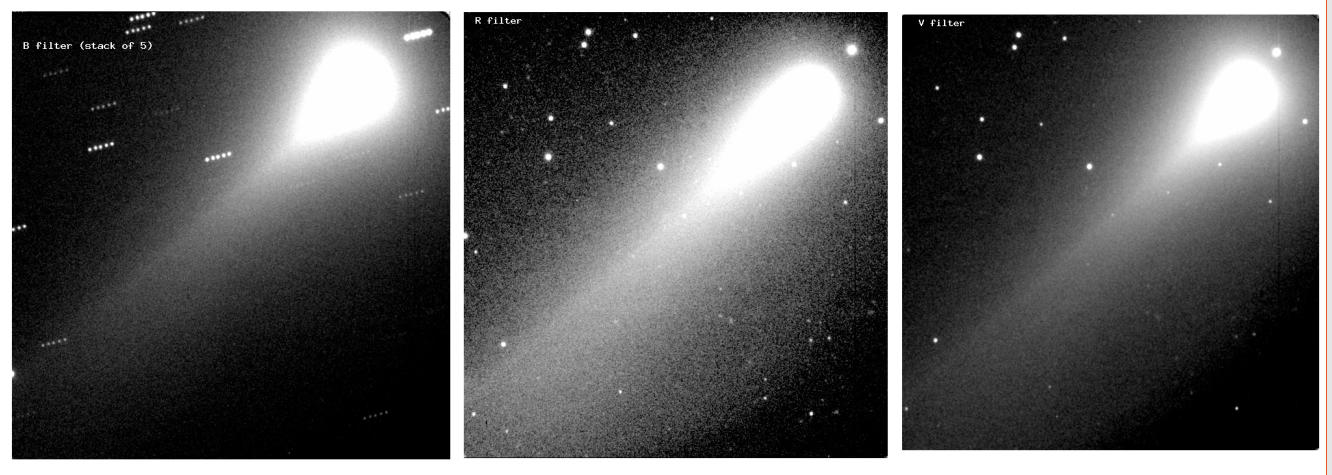
We have created an RGB – a true colour – image by co-adding the images in B, V and R. As the comet gets closer to the Sun, the nucleus of the comet gets hot, more of the ices melt and diffuse away from the surface, creating an extended, gas-rich cloud known as a coma. Sunlight striking the coma pushes the dust particles out of the coma and away from the Sun, creating a yellow/white tail: a dust tail. But coma has also gases created by sublimated ices like dry ice (solid CO2), methane (CH4), ammonia (NH3), and carbon monoxide (CO): these gases are mostly hydrogen, oxygen, carbon, and nitrogen. Two molecules that are of particular interest are cyanide/cyanogen (CN: a carbon-nitrogen bond) and diatomic carbon (C2: a carbon-carbon bond), and that is what gives the green colour to the coma: the Sun's UV light excite the electrons inside it, causing them to emit a green glow when they drop down in energy. Coma’s green colour is an indicator of a combination of things:
- that the coma contains large amounts of CN and C2 molecules,
- that the comet is active (outgassing) and warm (close to the Sun), and
- that the potential for an eruption or the comet's nucleus splitting apart is at its highest.
Observers: Margarita Safonova and Kiran B.S. (IIA). Image manipulation: Margarita Safonova, Bharat Chandra (IIA) and Olexandra Ivanova (Astronomical Inst. Slovak Academy of Science, Slovakia).
The comet demonstrates a very long tail – actually longer the HCT FOV (10’x10’). The cometary coma is asymmetric. Applying different enhancement techniques to the original images of the comet to make the faint structures visible, we have revealed two jet-like structures (marked by red arrows). These jets form the asymmetric cometary coma – in R filter (which reflects mostly dust) the coma is the usual oval shape, while B and V filters reveal mostly gas – that is why the coma shape is so different in these filters: the jets on both sides (marked by red arrows) create the triangular coma shape.
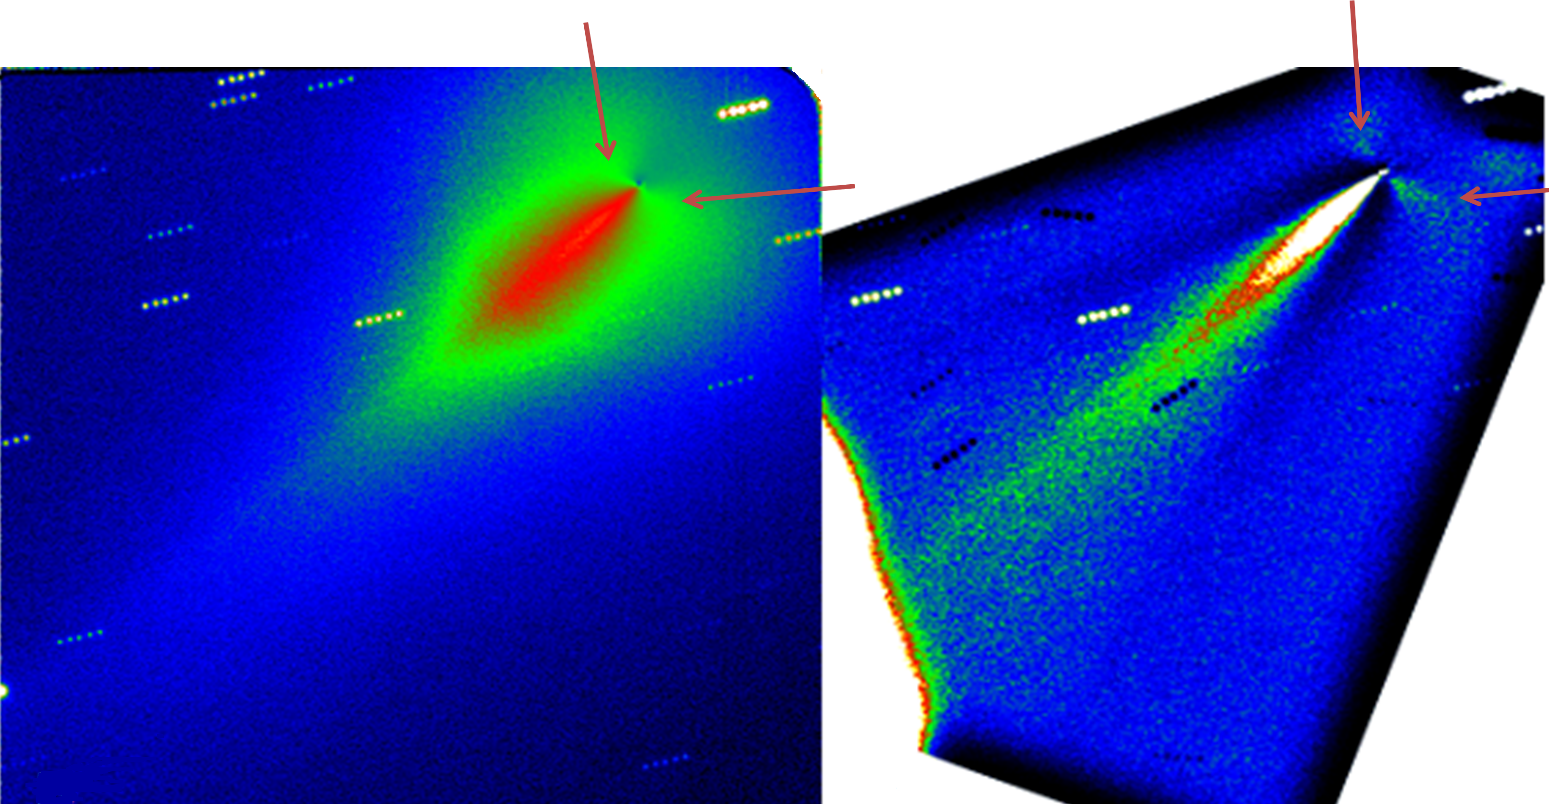
Intensity maps of comet C/2021 A1 Leonard in B filter. Left: image to which a division by 1/ profile was applied (Samarasinha & Larson 2014); Right: image processed by a rotational gradient method (Larson & Sekanina 1984).