 IIA ARCHANA SOAM
The ALMA-QUARKS Survey: Evidence of a Candidate High-mass Prestellar Core Aside a Bright-rimmed Cloud IRAS 18290-0924
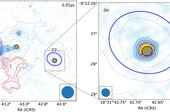
Although frequently reported in observations, the definitive confirmation of high-mass prestellar cores has remained elusive, presenting a persistent challenge in star formation studies. Using two-band observational data from the 3 mm ATOMS and 1.3 mm QUARKS surveys, we report a high-mass prestellar core candidate, C2, located on the side of the bright-rimmed cloud IRAS 18290-0924. The C2 core identified from the 3 mm continuum data of the ATOMS survey (∼2″, ∼10,000 au at 5.3 kpc) has a mass ranging from 27 to 68 M⊙ for temperatures 10─22 K within a radius of ∼2800 au. The highest-resolution (∼0 .″ 3, ∼1500 au) observations of this source presented to date from the QUARKS survey reveal no evidence of further fragmentation. Further analysis of a total ∼10 GHz bandwidth of molecular line survey does not find star formation activity (e.g., outflows and ionized gas) associated with the core, with a few molecular lines of cold gas detected only. Additionally, virial analysis indicates the C2 core is gravitationally bound (αvir ∼ 0.1−0.3) and thus could be undergoing collapse toward star formation. These results strongly establish a candidate for a high-mass prestellar core, contributing to the very limited number of such sources known to date.
 IIA SUDHANSHU BARWAY
ZTF25abjmnps (AT2025ulz) and S250818k: A Candidate Superkilonova from a Subthreshold Subsolar Gravitational-wave Trigger
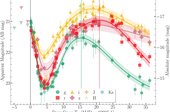
On 2025 August 18, the LIGO–Virgo–KAGRA collaboration reported gravitational waves from a subthreshold binary neutron star merger. If astrophysical, this event would have a surprisingly low chirp mass, suggesting that at least one neutron star was below a solar mass. The Zwicky Transient Facility mapped the coarse localization and discovered a transient, ZTF 25abjmnps (AT2025ulz), which was spatially and temporally coincident with the gravitational-wave trigger. The first week of follow-up suggested properties reminiscent of a GW170817-like kilonova. Subsequent follow-up suggests properties most similar to a young, stripped-envelope, Type IIb supernova. Although we cannot statistically rule out chance coincidence, we undertake due diligence analysis to explore the possible association between ZTF 25abjmnps and S250818k. Theoretical models have been proposed wherein subsolar neutron star(s) may form (and subsequently merge) via accretion-disk fragmentation or core fission inside a core-collapse supernova—i.e., a “superkilonova.” Here, we qualitatively discuss our multiwavelength dataset in the context of the superkilonova picture. Future higher-significance gravitational-wave detections of subsolar neutron star mergers with extensive electromagnetic follow-up would conclusively resolve this tantalizing multimessenger association.
 IIA ARCHANA SOAM
Magnetic Fields in the Bones of the Milky Way
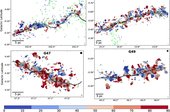
Stars primarily form in galactic spiral arms within dense, filamentary molecular clouds. The largest and most elongated of these molecular clouds are referred to as “bones,” which are massive, velocity-coherent filaments (lengths ∼20 to >100 pc, widths ∼1–2 pc) that run approximately parallel and in close proximity to the Galactic plane. While these bones have been generally well characterized, the importance and structure of their magnetic fields (B-fields) remain largely unconstrained. Through the Stratospheric Observatory for Infrared Astronomy Legacy program FIlaments Extremely Long and Dark: a Magnetic Polarization Survey (FIELDMAPS), we mapped the B-fields of 10 bones in the Milky Way. We found that their B-fields are varied, with no single preferred alignment along the entire spine of the bones. At higher column densities, the spines of the bones are more likely to align perpendicularly to the B-fields, although this is not ubiquitous, and the alignment shows no strong correlation with the locations of identified young stellar objects. We estimated the B-field strengths across the bones and found them to be ∼30–150 μG at parsec scales. Despite the generally low virial parameters, the B-fields are strong compared to the local gravity, suggesting that B-fields play a significant role in resisting global collapse. Moreover, the B-fields may slow and guide gas flow during dissipation. Recent star formation within the bones may be due to high-density pockets at smaller scales, which could have formed before or simultaneously with the bones.
 IIA KAJOL PAITHANKAR
Photon region boundary for stationary axisymmetric black holes
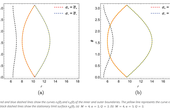
The black hole shadow is fundamentally connected to the structure of light rings and the photon region in the background geometry. We investigate the photon region boundary in a generic asymptotically flat, stationary, axisymmetric black hole spacetime that admits spherical photon orbits (SPOs). Explicit expressions possessing real solutions are provided for the photon regions boundary purely in terms of the background metric functions, independent of the photons parameters like energy or angular momentum, which are applicable to both separable and nonseparable spacetimes. We further analyze its common features, including overlap with the ergoregion and rotation sense of SPOs. Additionally, light rings are identified at the extrema of the photon region boundary curves in the ðr; θÞ plane. Our approach is validated against a few exact black hole solutions. Implications are discussed.
 IIA ANNAPURNI SUBRAMANIAM
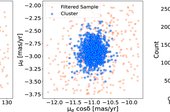
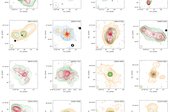
Tidal tails in open clusters: Morphology, binary fraction, dynamics, and rotation
This research presents unsupervised machine learning and statistical methods to identify and analyze tidal tails in open star clusters using data from the Gaia DR3 catalog. Aims. We aim to identify member stars and to detect and analyze tidal tails in five open clusters, BH 164, Alessi 2, NGC 2281, NGC 2354, and M 67, of ages between 60 Myr and 4 Gyr. These clusters were selected based on the previous evidence of extended tidal structures. Methods. We utilized machine learning algorithms such as Density-based Spatial Clustering of Applications with Noise (DBSCAN) and principal component analysis (PCA), along with statistical methods to analyze the kinematic, photometric, and astrometric properties of stars. Key characteristics of tidal tails, including radial velocity, the color-magnitude diagram, and spatial projections in the tangent plane beyond the cluster's Jacobi radius (rJ), were used to detect them. We used N-body simulations to visualize and compare the observables with real data. Further analysis was done on the detected cluster and tail stars to study their internal dynamics and populations, including the binary fraction. We also applied the residual velocity method to detect rotational patterns in the clusters and their tails. Results. We identified tidal tails in all five clusters, with detected tails extending farther in some clusters and containing significantly more stars than previously reported (tails ranging from 40 to 100 pc, one to four times their rJ, with 100─200 tail stars). The luminosity functions of the tails and their parent clusters were generally consistent, and tails lacked massive stars. In general, the binary fraction was found to be higher in the tidal tails. Significant rotation was detected in M 67 and NGC 2281 for the first time.
 IIA STALIN, C. S
Identification of Large-scale Radio Jets in Narrow-line Seyfert 1 Galaxies
Powerful, large-scale relativistic jets are usually associated with massive, old elliptical galaxies. This paradigm has recently been challenged by the identification of narrow-line Seyfert 1 (NLSy1) galaxies, thought to be young active galactic nuclei with low-mass black holes, harboring relativistic jets. Among them, sources hosting >100 kpc radio jets are extremely rare. Here, we report the discovery of large-scale, double-lobed radio structures in 33 NLSy1s with the projected linear size of at least 100 kpc from a recently published catalog of 22,656 NLSy1 galaxies. These 33 include 29 confirmed double-lobed sources and 4 candidates whose radio structure require further study. We suggest that their low black hole masses are unlikely to be due to their small angles of inclination to the line of sight. These enigmatic sources were identified by examining the radio observations taken with the Faint Images of the Radio Sky at Twenty Centimeters, Very Large Array Sky Survey, Low Frequency Array, and Rapid ASKAP Continuum Survey. Among them, the NLSy1 source J1318+2626 (z = 0.62) is found to host a radio jet with the projected linear size of 4.3 Mpc, making it the only NLSy1 galaxy hosting a Mpc-scale radio jet known as of today. We conclude that future observations of NLSy1 sources with the next generation of sensitive telescopes may reveal a much larger population harboring large-scale jets, thus providing crucial clues on their origin, propagation, and interaction with the ambient environment.
 IIA ARVIND BALASUBRAMANIAN
Continued Radio Observations of the Persistent Radio Source Associated with FRB 20190520B Provide Insights into Its Origin
Follow-up studies of persistent emission from fast radio burst (FRB) sources are critical for understanding their elusive emission mechanisms and the nature of their progenitors. This work presents new observations of the persistent radio source (PRS) associated with FRB 20190520B. We observe a gradual decay in the PRS brightness, which is punctuated by periods of brightening and dimming at both 1.5 and 3 GHz. Furthermore, our low-frequency (<1 GHz) observations—the first for this source—reveal evidence of a spectral break, which can be attributed to absorption processes. Interpreted within the framework of the magnetar wind nebula model, our data constrain the age of the magnetar progenitor to 52−10+16 yr, broadly consistent with previous work. Assuming the observed 1.5 GHz variability is driven by scintillation, we discuss the constraints on the size of the persistent source. The observations presented here challenge the predictions of the previously published best-fit hypernebula model for this source.
 IIA MUNEER, S
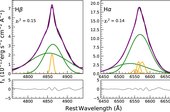
Spectroscopic Reverberation Mapping for SARM: The Case of Mrk 1048 and Mrk 618
Robust extragalactic distance measurements are crucial for resolving the persistent discrepancy in the value of the Hubble constant (H0). Active galactic nuclei (AGNs), through their compact and variable broad-line regions, enable the determination of geometric distances when reverberation mapping (RM) is combined with spectroastrometry. We report results from a spectroscopic RM campaign (2022 October─2023 March) targeting two narrow-line Seyfert 1 galaxies, Mrk 1048 and Mrk 618, using the 3.6 m Devasthal Optical Telescope and 2 m Himalayan Chandra Telescope. High-cadence spectrophotometric monitoring was carried out using onboard instruments such as ADFOSC, HFOSC, and TANSPEC, resulting in well-sampled continuum and emission-line light curves. The observed fractional variability (Fvar) ranged from 4% to 14% across the g-band, Hβ, and Hα light curves. The time lags were measured using the interpolated cross-correlation function (ICCF), PyI2CCF, and JAVELIN methods. In the rest frame, the ICCF analysis yields Hβ lags of 10.5−4.2+2.6 days for Mrk 1048 and 10.2−2.9+3.4 days for Mrk 618, while the corresponding Hα lags are 18.7−5.4+5.3 and 14.4−10.5+4.6 days, respectively. The emission-line widths, measured from the rms spectra using σline, give virial black hole mass estimates of 6.3−2.1+2.0×10⁷M⊙ for Mrk 1048 and 1.2−0.6+0.4×10⁷M⊙ for Mrk 618. These results will serve as a basis for absolute geometric distance calibration when combined with VLTI/GRAVITY spectroastrometric measurements, thereby contributing to the development of AGNs as standardizable cosmological probes
 IIA PUJA POREL
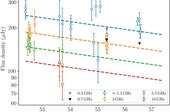
Unbound Tails and Compressed Heads: A JCMT Study of the SFO 38 Cloud
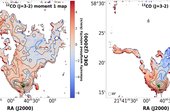
SFO 38, located in the Cepheus molecular cloud within the northern part of the H II region IC 1396, is shaped by intense ultraviolet (UV) radiation from the nearby O6.5V-type star HD 206267 and represents a classic example of a bright-rimmed cloud undergoing radiatively driven implosion (RDI). While previous studies have examined the southern globule using CS and 13CO (1–0), we present a refined analysis using high-resolution JCMT-HARP observations in the 12CO, 13CO, and C18O (J = 3 → 2) lines, deriving key physical parameters along with virial mass and turbulence properties of the southern head. We also perform the first detailed investigation of the northeastern and northwestern tails, determining their morphological dimensions and internal conditions, including excitation temperature, column density, mass, and volume density. Spectral and stability analyses reveal that the tail regions are gravitationally unbound and dynamically expanding, explaining the lack of active star formation. Our results further shed light on the evolutionary fate of these structures, assessing whether they may accumulate sufficient material to become future sites of star formation or remain quiescent. Overall, this work highlights the dual role of RDI in this bright-rimmed cloud: while it triggers star formation in the dense head, it simultaneously disperses and dynamically reshapes the extended tails.
 IIA GEETA RANGWAL
Orbits and vertical height distribution of 4006 open clusters in the galactic disk using Gaia DR3
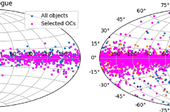
Open clusters (OCs) in the Galaxy are excellent probes for tracing the structure and evolution of the Galactic disk. We present an updated catalog of the fundamental and kinematic parameters for 1145 OCs, estimated using the data from Gaia DR3 earlier listed in Cantat-Gaudin et al. (2020). This sample is complemented by 3677 OCs with astrometric solution from the catalog by Hunt & Reffert (2023). Using the Galaxy potential and the space velocities, orbits of 4006 OCs were computed, and we provide a catalog with orbital parameters such as eccentricity, perigalactic and apogalactic distance, and the maximum vertical height traced by OCs from the Galactic disk. The OCs in the sample are found to be distributed between 5 and 16 kpc from the Galactic center, with older OCs showing a radially extended distribution. The low number of old OCs in the inner region of the Solar circle will likely suggest their destruction in this area. Using the orbital estimations, we explored the maximum vertical height (Zmax) OCs can reach. We derive a quantitative expression for the dependency of Zmax with the cluster’s age and Galactocentric radius for the first time. The young (age < 50 Myr) and the intermediate age (50 Myr < age < 1 Gyr) OCs show similar values of Zmax till 9 kpc, with the latter group higher values beyond. OCs older than 1 Gyr show larger values of Zmax at all Galactocentric radii and significantly larger values beyond 9 kpc. Higher values of Zmax are found in the third Galactic quadrant, suggesting the link between the higher values and the Galactic warp. This large sample shows that young OCs are also involved in the diagonal ridge formation in the solar neighborhood.