 IIA ARCHANA SOAM
Optical polarimetry study of the Lambda-Orionis star-forming region
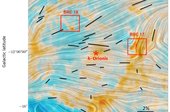
We present an optical polarimetry study of the nearby star-forming region Lambda-Orionis to map the plane-of-the-sky magnetic field geometry to understand the magnetized evolution of the HII region and the associated small molecular clouds. We made multiwavelength polarization observations of 34 bright stars distributed across the region. We also present the R-band polarization measurements that focused on the small molecular clouds, bright-rimmed clouds (BRC), BRC 17, and BRC 18, which are located at the periphery of the HII region. The magnetic field lines exhibit a large-scale ordered orientation consistent with the Planck submillimeter polarization measurements. The magnetic field lines in the two BRCs are found to be roughly in north-south directions. However, a larger dispersion is noted in the orientation for BRC 17 compared to BRC 18. Using a structure-function analysis, we estimate the strength of the plane-of-the-sky component of the magnetic field as ∼28 µG for BRC 17 and ∼40 µG for BRC 18. The average dust grain size and the mean value of the total-to-selective extinction ratio (RV ) in the HII region are found to be ∼0.51 ± 0.05 µm and ∼2.9 ± 0.3, respectively. The distance of the whole HII region is estimated as ∼392 ± 8 pc by combining astrometry information from Global Astrometric Interferometer for Astrophysics (Gaia) early data release 3 (EDR3) for young stellar objects associated with BRCs and confirmed members of the central cluster Collinder 69.
 IIA HARSH MATHUR
Simultaneous Spectropolarimetric Observations in the Hα and Ca II 8662Å Lines of an Active Region
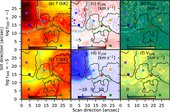
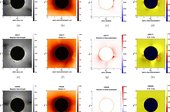
We present spectropolarimetric observations of an active region recorded simultaneously in the Hα and the Ca II 8662 Å lines. The sunspot exhibits multiple structures, including a light bridge and a region where the Ca II 8662 Å line core is in emission. Correspondingly, the Hα line core image displays brightening in the emission region, with the spectral profiles showing elevated line cores. The stratification of the line-of-sight magnetic field is inferred through nonlocal thermodynamic equilibrium multiline inversions of the Ca II 8662 Å line and the weak field approximation (WFA) over the Hα line. The field strength inferred from the Hα line core is consistently smaller than that inferred from inversions at log t500 = −4.5. However, the study finds no correlation between the WFA over the core of the Hα line and that inferred from inversions at log t500 = −4.5. In regions exhibiting emission features, the morphology of the magnetic field at log t500 = −4.5 resembles that at log t500 = −1, with slightly higher or comparable field strengths. The magnetic field morphology inferred from the core of the Hα line is also similar to that inferred from the full spectral range of the Hα line in the emission region. The field strength inferred in the light bridge at log t500 = −1 is smaller than the surrounding umbral regions and comparable at log t500 = −4.5. Similarly, the field strength inferred in the light bridge from the WFA over the Hα line appears lower compared to the surrounding umbral regions.
 IIA JUDHAJEET BASU
Exploring the Archives: A Search for Novae in UVIT Snapshots of M31
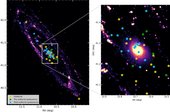
Extensive multiwavelength studies of novae have been carried out in our galaxy and in M31 for decades. However, UV studies of extragalactic novae are limited, especially those in quiescence. For the first time, we present a UV catalog of novae in M31 using the archival AstroSat Ultraviolet Imaging Telescope (UVIT) imaging data. We used two image subtraction techniques to retrieve objects located deep into the M31 central region. We have found 42 novae in total in the UVIT images, 15 of which have been detected in multiple filters in the far-ultraviolet (FUV) and near-ultraviolet. The novae detected at quiescence show signatures of accretion disk from their UV spectral energy distributions, whereas those in the outburst phase show signatures of a pseudo-photosphere. A few novae were also detected in multiple epochs. Some show a near-constant FUV magnitude at quiescence, while others caught near the outburst reveal pre-eruption dips in their light curves. We conclude with a discussion on the significance of UV surveys in illuminating theoretical predictions for novae systems, including detecting the elusive early UV flash.
 IIA NAGARAJU, K
Extreme-ultraviolet Polarimetric Diagnostics of the Solar Corona: The Hanle Effect of Ne VIII 770Å
Magnetic fields are the primary driver of the plasma thermodynamics in the upper solar atmosphere, especially in the corona. However, magnetic field measurements in the solar corona are sporadic, thereby limiting us from the complete understanding of physical processes occurring in the coronal plasma. In this paper, we explore the diagnostic potential of a coronal emission line in the extreme-ultraviolet, i.e., Ne viii 770 Å, to probe the coronal magnetic fields. We utilize 3D "Magnetohydrodynamic Algorithm outside a Sphere" models as input to the FORWARD code to model polarization in the Ne viii line produced as a result of resonance scattering, and we interpret its modification due to collisions and the magnetic fields through the Hanle effect. The polarization maps are synthesized both on the disk and off the limb. The variation of this polarization signal through the different phases of Solar Cycle 24 and the beginning phase of Solar Cycle 25 is studied in order to understand the magnetic diagnostic properties of this line owing to different physical conditions in the solar atmosphere. The detectability of the linear polarization signatures of the Hanle effect significantly improves with increasing solar activity, consistent with the increase in the magnetic field strength and the intensity of the mean solar brightness at these wavelengths. We finally discuss the signal-to-noise ratio requirements by considering realistic instrument designs.
 IIA ANOHITA MALLICK
Study of a Red Clump Giant, KIC 11087027, with High Rotation and Strong Infrared Excess—Evidence of Tidal Interaction for High Lithium Abundance
This Letter presents results from Kepler photometric light curves and a high-resolution spectroscopic study of a super-Li-rich giant KIC11087027. Using the light-curve analysis, we measured the star's rotational period Prot = 30.4 ± 0.1 days, which translates to rotational velocity Vrot = 19.5 ± 1.7 km s−1. The star's location in the Hertzsprung–Russell diagram, derived values of 12C/13C = 7 ± 1 and [C/N] = −0.95 ± 0.2, and the inferred asteroseismic parameters from secondary calibration based on spectra suggest the star is a low-mass red clump giant in the He-core burning phase. Using Gaia data, we found evidence of variation in radial velocity and proper motion, indicative of presence of an unresolved binary. The large Vrot is probably a result of tidal synchronization combined with the aftereffects of He flash, in which the size of the star is reduced significantly. The simultaneous presence of features like high rotation, very high Li abundance, strong dust shell, and strong flares in a single star is relatively uncommon, suggesting that the star experiencing tidal synchronization has recently undergone He flash. The results pose a question whether the binary interaction, hence the high rotation, is a prerequisite for the dredging up of the high amounts of Li from the interior to the photosphere during or immediately after the He-flash event.
 IIA SAHU, D. K
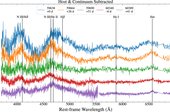
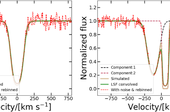
The Unluckiest Star: A Spectroscopically Confirmed Repeated Partial Tidal Disruption Event AT 2022dbl
The unluckiest star orbits a supermassive black hole elliptically. Every time it reaches the pericenter, it shallowly enters the tidal radius and gets partially tidally disrupted, producing a series of flares. Confirmation of a repeated partial tidal disruption event (pTDE) requires not only evidence to rule out other types of transients but also proof that only one star is involved, as TDEs from multiple stars can also produce similar flares. In this Letter, we report the discovery of a repeated pTDE, AT 2022dbl. In a quiescent galaxy at z = 0.0284, two separate optical/UV flares have been observed in 2022 and 2024 with no bright X-ray, radio, or mid-infrared counterparts. Compared to the first flare, the second flare has a similar blackbody temperature of ∼26,000 K, slightly lower peak luminosity, and slower rise and fall phases. Compared to the Zwicky Transient Facility TDEs, their blackbody parameters and light-curve shapes are all similar. The spectra taken during the second flare show a steeper continuum than the late-time spectra of the previous flare, consistent with a newly risen flare. More importantly, the possibility of two independent TDEs can be largely ruled out because the optical spectra taken around the peak of the two flares exhibit highly similar broad Balmer, N iii, and possible He ii emission lines, especially the extreme ∼4100 Å emission lines. This represents the first robust spectroscopic evidence for a repeated pTDE, which can soon be verified by observing the third flare, given its short orbital period.
 IIA JAVARAIAH, J
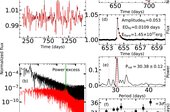
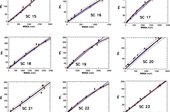
Prediction of the amplitude of solar cycle 25 from the ratio of sunspot number to sunspot-group area, low latitude activity, and 130-year solar cycle
Prediction of the amplitude of solar cycle is important for understanding the mechanism of solar cycle and solar activity influence on space-weather. We analysed the combined data of sunspot groups from Greenwich Photoheliographic Results (GPR) during the period 1874–1976 and Debrecen Photoheliographic Data (DPD) during 1977–2017 and determined the monthly mean, annual mean, and 13-month smoothed monthly mean whole sphere sunspot-group area (WSGA). We also analysed the monthly mean, annual mean, and 13-month smoothed monthly mean version 2 of international sunspot number (SNT) during the period 1874–2017. We fitted the annual mean WSGA and SNT data during each of Solar Cycles 12–24 separately to the linear and nonlinear (parabola) forms. In the cases of Solar Cycles 14, 17, and 24 the nonlinear fits are found better than the linear fits. We find that there exists a secular decreasing trend in the slope of the WSGA–SNT linear relation during Solar Cycles 12–24. A secular decreasing trend is also seen in the coefficient of the first order term of the nonlinear relation. The existence of ≈77-year variation is clearly seen in the ratio of the amplitude to WSGA at the maximum epoch of solar cycle. From the pattern of this long-term variation of the ratio we inferred that Solar Cycle 25 will be larger than both Solar Cycles 24 and 26. Using an our earlier method (now slightly revised), i.e. using high correlations of the amplitude of a solar cycle with the sums of the areas of sunspot groups in 0–10° latitude intervals of the northern hemisphere during 3.75-year interval around the minimum–and the southern hemisphere during 0.4-year interval near the maximum–of the corresponding preceding solar cycle, we predicted 127±26 and 141±19 for the amplitude of Solar Cycle 25, respectively. Based on ≈130-year periodicity found in the cycle-to-cycle variation of the amplitudes of Solar Cycles 12–24 we find the shape of Solar Cycle 25 would be similar to that of Solar Cycle 13 and predicted for Solar Cycle 25 the amplitude 135±8, maximum epoch 2024.21 (March 2024)±6-month, and the following minimum epoch 2032.21 (March 2032)±6-month with SNT ≈4.
 IIA ANNAPURNI SUBRAMANIAM
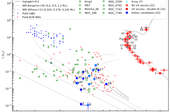
UOCS XIV. Uncovering extremely low-mass white dwarfs and blue lurkers in NGC 752
Evolutionary pathways of binary systems are vastly different from single stellar evolution, and thus there is a need to quantify their frequency and diversity. Thanks to their to their coeval nature, open clusters are the best test beds for unveiling the secrets of binary populations. The availability of multi-wavelength data in recent years has been critical in characterising the binary population. Aims. NGC 752 is a solar-metallicity, intermediate-age open cluster located at 460 pc. In this work, we aim to identify the optically sub-luminous white dwarfs in NGC 752 and identify the elusive blue lurkers by association. Methods. We used multi-wavelength photometry from AstroSat/UVIT, Swift/UVOT, Gaia DR3, and other archival surveys to analyse the colour-magnitude diagrams and spectral energy distributions of 37 cluster members. Results. We detected eight white dwarf companions of cluster members. Four of the systems are main sequence stars with extremely low-mass white dwarfs as their companions. Two of these main sequence stars are also fast rotators. Conclusions. The presence of low-mass white dwarfs and fast rotation signals a past mass transfer, and we classify the four main sequence stars as blue lurkers. The binary fraction in NGC 752 is estimated to be 50–70%, and it shows that the contribution of optically undetected stars is crucial in quantifying the present-day binary fraction.
 IIA VIVEK, M
FLAME: Fitting Lyα absorption lines using machine learning
We introduce FLAME, a machine-learning algorithm designed to fit Voigt profiles to H I Lyman-alpha (Lyα) absorption lines using deep convolutional neural networks. FLAME integrates two algorithms: the first determines the number of components required to fit Lyα absorption lines, and the second calculates the Doppler parameter b, the H I column density NHI, and the velocity separation of individual components. For the current version of FLAME, we trained it on low-redshift Lyα forests observed with the far-ultraviolet gratings of the Cosmic Origin Spectrograph (COS) on board the Hubble Space Telescope (HST). Using these data, we trained FLAME on ∼106 simulated Voigt profiles – which we forward-modeled to mimic Lyα absorption lines observed with HST-COS – in order to classify lines as either single or double components and then determine Voigt profile-fitting parameters. FLAME shows impressive accuracy on the simulated data, identifying more than 98% (90%) of single (double) component lines. It determines b values within ≈ ± 8 (15) km s−1 and log NHI/cm2 values within ≈ ± 0.3 (0.8) for 90% of the single (double) component lines. However, when applied to real data, FLAME’s component classification accuracy drops by ∼10%. Nevertheless, there is reasonable agreement between the b and NHI distributions obtained from traditional Voigt profile-fitting methods and FLAME’s predictions. Our mock HST-COS data analysis, designed to emulate real data parameters, demonstrates that FLAME is able to achieve consistent accuracy comparable to its performance with simulated data. This finding suggests that the drop in FLAME’s accuracy when used on real data primarily arises from the difficulty in replicating the full complexity of real data in the training sample. In any case, FLAME’s performance validates the use of machine learning for Voigt profile fitting, underscoring the significant potential of machine learning for detailed analysis of absorption lines.
 IIA MANJUNATH HEGDE
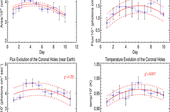
Thermal and magnetic field structure of near-equatorial coronal holes
Coronal holes are low-density and unipolar magnetic field structures in the solar corona that trigger geomagnetic disturbances on the Earth. Hence, it is important to understand the genesis and evolutionary behavior of these coronal activity features during their passage across the solar disk. Aims. We study the day-to-day latitudinal variations of thermal and magnetic field structures of near-equatorial coronal holes. For this purpose, eight years of full-disk SOHO/EIT 195 Å calibrated images were used. Methods. Using the response curves of the SOHO/EIT channels and assuming thermodynamic equilibrium, we estimated the temperature structure of coronal holes. From the latitudinal variation in the magnetic pressure, we inferred the magnitude of the magnetic field structure of coronal holes. Results. Except for the temperature T, we find that the variations in the average photon flux F, in the radiative energy E, in the area A, and in the magnitude of the magnetic field structure |B| of coronal holes depend on latitude. The typical average values of the estimated physical parameters are A ∼ 3.8(±0.5)×1020 cm2, F ∼ 2.3(±0.2)×1013 photons cm−2 s−1, E ∼ 2.32(±0.5)×103 ergs cm−2 s−1, T ∼ 0.94(±0.1)×106 K and |B|∼0.01(±0.001) G. Conclusions. When coronal holes are anchored in the convection zone, these activity features would be expected to rotate differentially. The thermal wind balance and isorotation of coronal holes with the solar plasma therefore implies a measurable temperature difference between the equator and the two poles. Contrary to this fact, the variation in the thermal structure of near-equatorial coronal holes is independent of latitude, which leads to the conclusion that coronal holes must rotate rigidly and are likely to be initially anchored below the tachocline. This confirms our previous study.