 IIA SUSHREE S. NAYAK
On the magnetic reconnection and its properties during a flare using a magnetohydrodynamics simulation
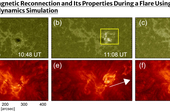
We study the magnetic reconnection during a flare by investigating flare ribbon dynamics using observations and data-constrained magnetohydrodynamics (MHD) simulation. In particular, we estimate the reconnection flux and the reconnection flux rates using flare ribbons of an M1.1 flare hosted by the active region 12184 utilizing the technique developed by Qiu et al. (2002). The reconnection flux and corresponding flux rates are found to be Mx and Mx s−1 respectively. To understand the flare onset and the origin of flare ribbons, we perform an MHD simulation initiated by the non-force-free-field extrapolation. Importantly, the extrapolated configuration identifies a three-dimensional (3D) magnetic neutral point and a flux rope in the flaring region, which is crucial to the flaring activity. The reconnection initiates at the null point and, subsequently the flux rope rises and appears to reconnect there, which is favorable for the eruption of the filament. The surrounding field lines also seem to take part in the null point reconnection. In later stage, a current sheet is formed below the null point ensuing a secondary reconnection near an X-type topology, further contributing to the energy release process in the flare. We trace the footpoint evolution of the field lines lying over the flare ribbons and find a significant similarity between the observed flare ribbons and the evolution of footpoints computed from the MHD simulation. We estimated induced electric field during the flare and found it to be ≈ 0.52 V cm−1, a slight less value, as per many past literatures. Additional findings are the enhancement of vertical current density near the flaring ribbons, a signature of successive reconnections near the null point. Overall, the present work contributes to the understanding of the ribbon formation in a flaring process and the involved magnetic reconnection.
 IIA ARCHANA SOAM
The JCMT BISTRO-3 survey: Variation of magnetic field orientations on parsec and subparsec scales in the massive star-forming region G28.34+0.06
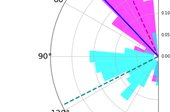
Magnetic fields play a significant role in star-forming processes on core to clump scales. We investigate magnetic field orientations and strengths in the massive star-forming clump P2 within the filamentary infrared dark cloud G28.34+0.06 using dust polarization observations made using SCUBA-2/POL-2 on the James Clerk Maxwell Telescope (JCMT) as part of the B-field In STar-forming Region Observations (or BISTRO) survey. We compare the magnetic field orientations at the clump scale of ∼2 pc from these JCMT observations with those at the core scale of ∼0.2 pc from archival Atacama Large Millimeter/submillimeter Array data, finding that the magnetic field orientations on these two different scales are perpendicular to one another. We estimate the distribution of magnetic field strengths, which range from 50 to 430 μG over the clump. The region forming the core shows the highest magnetic field strength. We also obtain the distribution of mass-to-flux ratios across the clump. In the region surrounding the core, the mass-to-flux ratio is larger than 1, which indicates that the magnetic field strength is insufficient to support the region against gravitational collapse. Therefore, the change in the magnetic field orientation from clump to core scales may be the result of gravitational collapse, with the field being pulled inward along with the flow of material under gravity
 IIA VINOD KRISHAN
Coupling of Alfven and magnetosonic waves in rotating hall magnetoplasmas
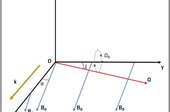
We study the linear theory of magnetohydrodynamic (MHD) waves, namely, the Alfvén and the fast and slow magnetosonic modes in a rotating Hall-MHD plasma with the effects of the obliqueness of the external magnetic field and the Coriolis force and show that these waves can be coupled either by the influence of the Coriolis force or the Hall effects. To this end, we derive a general form of the linear dispersion relation for these coupled modes by the combined influence of the Coriolis force and the Hall effects and analyze numerically their characteristics in three different plasma- β regimes: β∼1, β>1, and β<1, including some particular cases. We show that while the coupling between the Alfvén and the fast magnetosonic modes is strong in the low- β(β≲1) regime and the wave dispersion appears in the form of a thumb curve, in the high- β (β>1) regime, the strong coupling can occur between the Alfvén and the slow magnetosonic modes and the dispersion appears in the form of a teardrop curve. Switching of the coupling in the regime of β∼1 can occur, i.e., instead of a thumb curve, a teardrop curve appears when the obliqueness of propagation and rotational angle are close to 70° or more (but less than 90°). Implications of our results to solar and fusion plasmas are briefly discussed
 IIA TANMOY SAMANTA
Formation of chromospheric fan-shaped jets through magnetic reconnection
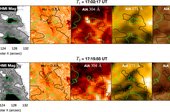
Recurrent chromospheric fan-shaped jets highlight the highly dynamic nature of the solar atmosphere. They have been named as “light walls” or “peacock jets” in high-resolution observations. In this study, we examined the underlying mechanisms responsible for the generation of recurrent chromospheric fan-shaped jets utilizing data from the Goode Solar Telescope at Big Bear Solar Observatory, along with data from the Atmospheric Imaging Assembly (AIA) and the Helioseismic and Magnetic Imager (HMI) on board the Solar Dynamics Observatory. These jets appear as dark elongated structures in Hα wing images, persist for over an hour, and are located in the intergranular lanes between a pair of same-polarity sunspots. Our analysis reveals that magnetic @ux cancellation at the jet base plays a crucial role in their formation. HMI line-of-sight magnetograms show a gradual decrease in opposite-polarity @uxes spanning the sequence of jets in Hα−0.8 Å images, suggesting that recurrent magnetic reconnection, likely driven by recurrent miniature @ux-rope eruptions that are built up and triggered by @ux cancellation, powers these jets. Additionally, magnetic Beld extrapolations reveal a 3D magnetic null-point topology at the jet formation site ∼1.25 Mm height. Furthermore, we observed strong brightening in the AIA 304 Å channel above the neutral line. Based on our observations and extrapolation results, we propose that these recurrent chromospheric fan-shaped jets align with the miniBlament eruption model previously proposed for coronal jets. Though our study focuses on fan-shaped jets in between same-polarity sunspots, a similar mechanism might be responsible for light-bridge-associated fan-shaped jets.
 IIA PIYALI CHATTERJEE
Computational astrophysics, data science and AI/ML in astronomy: A perspective from Indian community
In contemporary astronomy and astrophysics (A&A), the integration of high-performance computing (HPC), big data analytics, and artificial intelligence/machine learning (AI/ML) has become essential for advancing research across a wide range of scientific domains. These tools are playing an increasingly pivotal role in accelerating discoveries, simulating complex astrophysical phenomena, and analyzing vast amounts of observational data. For India to maintain and enhance its competitive edge in the global landscape of computational astrophysics and data science, the Indian A&A community must embrace these transformative technologies fully. Despite limited resources, the expanding Indian community has made significant scientific contributions. However, to remain globally competitive in the coming years, it is vital to establish a robust national framework that provides researchers with reliable access to state-of-the-art computational resources. This system should involve the regular solicitation of computational proposals, which can be assessed by domain experts and HPC specialists, ensuring that high-impact research receives the necessary support. India can develop the talent, infrastructure, and collaborative environment necessary for world-class research in computational astrophysics and data science.
 IIA ARKAPRABHA SARANGI
Large cold dust reservoir revealed in transitional SN Ib 2014C by James Webb Space Telescope mid-infrared spectroscopy
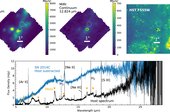
Supernova (SN) 2014C is a rare transitional event that exploded as a hydrogen-poor, helium-rich Type Ib SN and subsequently interacted with a hydrogen-rich circumstellar medium (CSM) a few months postexplosion. This unique interacting object provides an opportunity to probe the mass-loss history of a stripped-envelope SN progenitor. Using the James Webb Space Telescope (JWST), we observed SN 2014C with the Mid-Infrared Instrument Medium Resolution Spectrometer at 3477 days postexplosion (rest frame), and the Near-Infrared Spectrograph Integral Field Unit at 3568 days postexplosion, covering 1.7–25 μm. The bolometric luminosity indicates that the SN is still interacting with the same CSM that was observed with the Spitzer Space Telescope 40–1920 days postexplosion. JWST spectra and near-contemporaneous optical and near-infrared spectra show strong [Ne II] 12.831 μm, He 1.083 μm, Hα, and forbidden oxygen ([O I] λλ6300, 6364, [O II] λλ7319, 7330, and [O III] λλ4959, 5007) emission lines with asymmetric profiles, suggesting a highly asymmetric CSM. The mid-IR continuum can be explained by ∼0.036 M⊙ of carbonaceous dust at ∼300 K and ∼0.043 M⊙ of silicate dust at ∼200 K. The observed dust mass has increased tenfold since the last Spitzer observation 4 yr ago, with evidence suggesting that new grains have condensed in the cold dense shell between the forward and reverse shocks. This dust mass places SN 2014C among the dustiest SNe in the mid-IR and supports the emerging observational trend that SN explosions produce enough dust to explain the observed dust mass at high redshifts.
 IIA SIVARANI, T
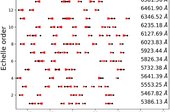
Doppler shifted transient sodium detection by KECK/HIRES
We carried out the first high-resolution transit observations of the exoplanet WASP-49 Ab with Keck/HIRES. Upon custom wavelength calibration we achieve a Doppler RV precision of < 60 ms−1 . This is an improvement in RV stability of roughly 240 ms−1 with respect to the instrument standard. We report an average sodium flux residual of ΔFNaD/F⋆(λ)∼ 3.2 ± 0.4 per cent (8.0 σ ) comparable to previous studies. Interestingly, an average Doppler shift of ‑6.2 ± 0.5 kms−1 (12.4 σ ) is identified offset from the exoplanet rest frame. The velocity residuals in time trace a blueshift (v Γ,ingress∼ ‑10.3 ± 1.9 kms−1 ) to redshift (v Γ,egress∼ + 4.1 ± 1.5 kms−1 ), suggesting the origin of the observed sodium is unlikely from the atmosphere of the planet. The average Na light curves indicate a depth of ΔFNaD/F⋆(t)∼ 0.47 ± 0.04 per cent (11.7 σ ) enduring ≲ 90 min with a half-max duration of ∼ 40.1 min. Frequent high-resolution spectroscopic observations will be able to characterize the periodicity of the observed Doppler shifts. Considering the origin of the transient sodium gas is of unknown geometry, a co-orbiting natural satellite may be a likely source.
 IIA SHUBHA, B. S
Computations of eclipses from 14th-century manuscript Ekanāthakaraṇa
The procedures followed for computations of eclipses in the classical treatises are best understood with a practical demonstration of the technique. Here, we have studied manuscripts describing the computations. These are authored by Ekanātha of the 14th century, whose works are not well known. We demonstrate the procedure by practical verification of each step and finally comparing the results with currently available computations. In the process, the finer details of valuable tools, like the iteration method, are brought to light. The drawings of the eclipses are presented as per the procedure. The possible causes for the observed discrepancies in the results are discussed.
 IIA RAMYA, S
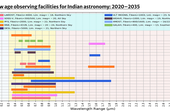
New age observing facilities for Indian astronomy: 2020–2035
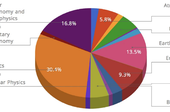
In this article, we present the current state of observing facilities available for Indian astronomers in various wavelength bands existing in the country. We also mention a few state-of-the-art astronomical facilities across the globe and contrast them with the Indian facilities. We then present a vision for improving our facilities to raise world-class capabilities. This process involves (a) upgrading the current facilities, (b) partnering in mega-science projects across the globe, (c) continued involvement in International projects, and (d) creating our large-scale facilities. These steps are divided into short, medium, and long-term tasks/projects. Recommendations for building large telescopes with versatile back-end instruments on Indian soil for Indian astronomers have been provided for each wavelength band. All these world-class astronomical observing facilities warrant cutting-edge technologies ranging from signal/image processing, high-performance computing, algorithms, and AI/ML. We hope this exercise will start a discussion and eventually lead to the initiation of these projects, which will result in significant scientific breakthroughs in the coming decades.
 IIA SRIRAM, S
Optical design studies for national large optical-IR telescope
A 10–12 m class national large optical-IR telescope (NLOT) is envisaged to meet the growing scientific requirements in astronomy and astrophysics. Telescopes of such dimensions can only be made by segmenting the primary mirror, as it eases a more prominent primary mirror’s fabrication, transportation, operation, and maintenance process. This paper presents the various optical designs analyzed for NLOT that can be fabricated using the India TMT Optics Fabrication Facility (ITOFF) at the Centre for Research and Education in Science and Technology (CREST) campus. We present the primary mirror segmentation details, its ideal optical performance, and study each design’s advantages and technical complexities. Based on the above analysis, we have narrowed it down to an optimal design, and its performance analysis is also discussed.