 IIA JAYANT MURTHY
Modeling the cosmic ultraviolet background at the north galactic pole
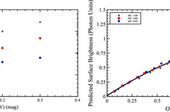
I explore models of the dust-scattered component of the cosmic ultraviolet background (CUVB) at the north galactic pole (NGP) to develop a framework for calculating the dust-scattered light as a function of the optical depths. As expected, I find that the dust-scattered emission scales linearly, with reddening up to E(B − V) ≈ 0.1 mag and derive a parametric model for this dependence. I have applied these models to fit the far-ultraviolet (1350–1800 Å) observations from the galaxy evolution explorer (GALEX) finding that the optical constants of the interstellar dust grains—albedo (a) and phase function asymmetry factor (g)—are consistent with predictions from the Astrodust model (a = 0.33, g = 0.68). I detect an isotropic offset of 267 ± 7 ph cm−2 s−1 sr−1 Å−1, half of which remains unaccounted for, by known Galactic or extragalactic sources. I will now extend my analysis to wider sky regions with the goal of generating high-resolution extinction maps.
 IIA MRIDWEEKA SINGH
SN 2021tsz: A luminous, short photospheric phase Type II supernova in a low-metallicity host
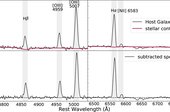
We present the analysis of the luminous Type II Supernova (SN) 2021tsz, which exploded in a low-luminosity galaxy. It reached a peak magnitude of −18.88 ± 0.13 mag in the r band and exhibited an initial rapid decline of 4.05 ± 0.14 mag (100 d)−1 from peak luminosity till ∼30 d. The photospheric phase is short, with the SN displaying bluer colours and a weak Hα absorption component–features consistent with other luminous, short-photospheric phase Type II SNe. A distinct transition from the photospheric to the radioactive tail phase in the V band–as is common in hydrogen-rich Type II SNe–is not visible in SN 2021tsz, although a modest ∼1 mag drop is apparent in the redder filters. Hydrodynamic modelling suggests the luminosity is powered by ejecta-circumstellar material (CSM) interaction during the early phases (<30 days). Interaction with 0.6 M of dense CSM extending to 3100 R reproduces the observed luminosity, with an explosion energy of 1.3 × 1051 erg. The modelling indicates a pre-SN mass of 9 M , which includes a hydrogen envelope of 4 M , and a radius of ∼1000 R . Spectral energy distribution analysis and strong-line diagnostics revealed that the host galaxy of SN 2021tsz is a low-metallicity, dwarf galaxy. The low-metallicity environment and the derived high mass loss from the hydrodynamical modelling strongly support a binary progenitor system for SN 2021tsz.
 IIA BHARAT KUMAR YERRA
Asteroseismology of Carbon-deficient Red Giants: Merger Products of Hierarchical Triple Systems?
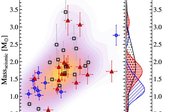
Carbon-deficient giants (CDGs) are a rare and chemically peculiar class of stars whose origins remain under active investigation. We present an asteroseismic analysis of the entire known CDG population, selecting 129 stars observed by Kepler, K2, and TESS to obtain seismic constraints. We detect solar-like oscillations in 43 CDGs. By measuring max and applying seismic scaling relations, we determine precise masses for these stars, f inding that 79% are low mass (M ≲ 2M ⊙ ). The luminosity distribution is bimodal, and the CDGs separate into three chemically and evolutionarily distinct groups, characterized by clear trends in sodium and CNO abundances, α-element enhancement, and kinematics. We find that two of these groups are only distinguished by their initial α-element abundances, thus effectively reducing the number of groups to two. Lithium enrichment is common across all groups, linking CDGs to lithium-rich giants and suggesting a shared evolutionary origin. We find that the spectroscopic log g is systematically offset from seismic values. Group 1 CDG patterns are most consistent with formation through core He-flash mixing, while the more massive and more chemically processed Groups 2 and 2α likely formed through mergers involving helium white dwarfs, possibly in hierarchical triples. Pollution from asymptotic giant branch stars appears very unlikely, given the unchanged [C+N+O] abundance across all groups.
 IIA MAHESWAR, G
Imprints of Stellar Feedback on Magnetic Fields in the Iris Nebula NGC 7023
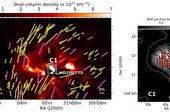
We present 850 μm polarized continuum observations carried out using SCUBA-2/POL-2 on the James Clerk Maxwell Telescope toward a reflection nebula, NGC 7023. The nebula is powered by the Herbig Ae Be star HD 200775 and also forms a hub in the hub-filament cloud, LDN 1172/1174. We detect submillimeter emission to the north and east of the location of the central star. The magnetic field (B-field) morphology is found to be curved and follows the clump morphology. The comparison of the B-field morphology at the clump scales (∼0.02 pc) derived using POL-2 data with that of the envelope scale (∼0.5 pc) derived using archival Planck/optical polarimetric observations suggests that the field lines are not preserved from envelope to clump scales. We suggest that this reordering of the magnetic field lines could be due to the interaction with the already evolved high-velocity outflow gas around the central star, which hints at the presence of outflow feedback. We estimated a B-field strength of 179 ± 50 μG in the starless core, and 121 ± 34 μG and 150 ± 42 μG in the protostellar cores, using the N2H+ (1–0) line observed with the 13.7 m single-dish telescope at the Taeduk Radio Astronomy Observatory (TRAO). The stability analysis gives magnetically subcritical values, while the magnetic, gravitational, and outflow kinetic energies are roughly balanced. Our study unveils the first possible evidence for magnetic field lines being shaped by outflow feedback in the vicinity of a photodissociation region driven by an intermediate-mass, pre-main-sequence star.
 IIA PALLAVI SARAF
On the Origin of Neutron-capture Elements in r-I and r-II Stars: A Differential-abundance Analysis
We present a strictly line-by-line differential analysis of a moderately r-process-enhanced star (r-I: HD 107752) with respect to a strongly r-process-enhanced star (r-II: CS 31082-0001) to investigate the possible common origin of their heavy-element nucleosynthesis with high-precision abundances. This study employs European Southern Observatory data archive high-resolution and high-signal-to-noise spectra taken with the Ultraviolet and Visual Echelle Spectrograph Very Large Telescope spectrograph. Considering only the lines in common in both spectra, we estimate differential abundances of 16 light/Fe-peak elements and 15 neutron-capture elements. Abundances of O, Al, Pr, Gd, Dy, Ho, Er, and a detection of Tm in HD 107752, are presented for the first time. We found three distinct features in the differential-abundance pattern. Nearly equal abundances of light elements up to Zn are present in both stars, indicating a common origin for these elements; in addition to no noticable odd– even differential pattern. Regarding the neutron-capture elements, the r-I star exhibits mildly depleted light r-process elements and more depleted heavier r-process elements relative to r-II star. We also show that, among the r-I and r-II stars, the ratio of lighter-to-heavier r-process elements (e.g., [(Sr, Y, Zr)/Eu]) exhibits a decreasing trend with respect to the overall r-process enhancement, forming a continuous sequence from the r-I to the r-II stars. Finally, we discuss the necessity of multiple sites for the formation of r-I stars.
 IIA RAVI JOSHI
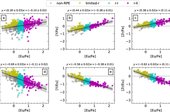
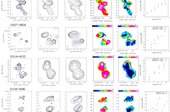
Evidence for In-Situ Acceleration of Relativistic Particles in the Wings of X-shaped Radio Galaxies
We report evidence for in-situ acceleration/reacceleration of relativistic particles in 11 radio wings out of a total of 68 wings sufficiently well-resolved for spectral mapping, which belong to our sample of 40 X-shaped radio galaxies (XRGs). This representative XRG sample includes 15 XRGs newly reported here, which we selected from the LOTSS-DR2 survey, following well-defined criteria. The evidence for in-situ particle acceleration comes from the observed cessation of steepening, or even flattening (i.e., gradient reversal) of the spectral index profile along the lobe into the associated wing, as determined here by combining the LoTSS-DR2 (144 MHz) and FIRST (1.4 GHz) maps. Interestingly, the aforementioned trends in spectral gradient, indicative of in-situ particle acceleration, are mostly found to set in near the region where the lobe plasma stream bends to connect to the wing. Such a spatial coincidence with the bending of the radio lobe/tail has been noticed in recent years for just a couple of radio galaxies. The large increase in such examples, as reported here, is expected to give a fillip to observational, theoretical, and numerical simulation follow-up investigations of this important clue about the occurrence of in-situ particle acceleration in lobes of radio galaxies.
 IIA VEMAREDDY, P
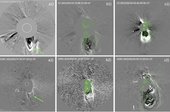
An Intense Geomagnetic Storm Originated from Stealth Coronal Mass Ejection: Remote and In Situ Observations by Near Radially Aligned Spacecraft
We investigate the solar origin and heliospheric evolution of an intense geomagnetic storm that occurred on 2023 March 23─24. Despite multiple candidate coronal mass ejections (CMEs) observed between March 19 and 21, a weak CME detected on March 19 at 18:00 UT was identified as the cause, originating from the eruption of a longitudinal-filament channel near the center of the Sun. The channel underwent a smooth transition to the eruption phase without detectable low-coronal signatures. Wide-angle heliospheric imaging revealed asymmetric expansion and acceleration by solar wind drag, achieving an average CME velocity of ≍640 km s−1. The radial evolution of the interplanetary coronal mass ejection (ICME) was analyzed by three spacecraft in close radial alignment. Arrival times and propagation speeds were consistent across spacecraft, with a 21 hr delay between STEREO-A (STA) and WIND attributed to solar rotation and longitudinal separation. The ICME exhibits magnetic cloud (MC) signatures characterized by right-handed helicity, enhanced density at all three spacecraft. The MC underwent expansion (radial-size increases from 0.08 au at SolO to 0.18 au at STA), a decrease in magnetic field strength with distance; Bav∝RH−1.97 (SolO-STA) and Bav∝RH−1.53 (SolO-WIND). The MC axis is inclined with the ecliptic at −69° at SolO, −25° at STA, and −34° at WIND, indicating rotation during heliospheric transit. Importantly, the storm's main phase leads to a peak intensity (SYM-H= −169 nT) occurring at 24/02:40 UT, followed by a second peak (SYM-H = −170 nT) at 24/05:20 UT due to density enhancement toward MC's tail. The study emphasizes the significant geoeffectiveness of weak, stealth CMEs with southward Bz and density enhancements.
 IIA MANJUNATH BESTHA
A new broad-band atmospheric dispersion corrector for HROS-TMT
Atmospheric dispersion causes light from celestial objects with different wavelengths to refract at varying angles as it passes through Earth’s atmosphere. This effect results in an elongated image at the focal plane of a telescope and diminishes fibre coupling efficiency into spectrographs. We propose an optical design that incorporates a Rotational Atmospheric Dispersion Corrector (RADC) to address the broad-band dispersion for the multi-object mode of the High-Resolution Optical Spectrograph (HROS) on the Thirty Meter Telescope (TMT). The RADC corrects the dispersion across the entire wavelength range (0.31–1 μm), using Amici prisms optimized for over 90 per cent transmission efficiency and minimal angular deviation of the beam from the optical axis after dispersion correction. For enhanced accuracy, particularly in the blue region, we have, for the first time, implemented the Filippenko model in Zemax via a custom Dynamic-Link Library (DLL) file.
 IIA SUSHREE S. NAYAK
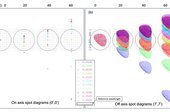
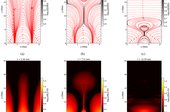
Role of magnetic shear distribution in the formation of eruptive flux ropes
Erupting flux ropes play a crucial role in powering a wide range of solar transients, including flares, jets, and coronal mass ejections. These events are driven by the release of stored magnetic energy, facilitated by the shear in complex magnetic topologies. However, the mechanisms governing the formation and eruption of flux ropes, particularly the role of magnetic shear distribution in coronal arcades, are not fully understood. Aims. We investigate how the spatial distribution of magnetic shear along coronal arcades influences the formation and evolution of eruptive flux ropes, with a focus on the evolution of mean shear during different phases of the eruption process.Methods. We employed 2.5D resistive magnetohydrodynamic (MHD) simulations incorporating nonadiabatic effects of optically thin radiative losses, magnetic field-aligned thermal conduction, and spatially varying background heating in order to realistically model the coronal environment. A stratified solar atmosphere under gravity was initialized with a non-force-free field comprising sheared arcades. We studied two different cases by varying the initial shear to analyze their resulting dynamics and the possibility of flux rope formation and eruptions. Results. Our results show that strong initial magnetic shear leads to spontaneous flux rope formation and eruption via magnetic reconnection, driven by the Lorentz force. The persistence and distribution of shear along the arcades are crucial in determining the formation and onset of flux rope instabilities. The shear distribution infers the non-potentiality distributed along arcades and demonstrates its relevance in identifying sites prone to eruptive activity. We have explored the evolution of mean shear and the relative strength between guide field and reconnection field during the pre- and post-eruption phases, with implications of bulk heating for the “hot onset” phenomena in flares, and particle acceleration. In contrast, the weaker shear case does not lead to the formation of any flux ropes. Conclusions. The spatial distribution of magnetic shear and its evolution and mean shear play a decisive role in the dynamics of flux rope formation and eruption. Our findings highlight the limitations of relying solely on footpoint shear and underscore the need for coronal-scale diagnostics. These results are relevant for understanding eruptive onset conditions and can promote a better interpretation of coronal observations from current and future missions.
 IIA SUBINOY DAS
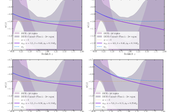
DESI results: hint towards coupled dark matter and dark energy
We investigate a scenario where a dark energy quintessence field ϕ with positive kinetic energy is coupled with dark matter. With two different self-interaction potentials for the field and a particular choice of the coupling function, we show explicitly how the observable effective equation of state parameter weff for the dark energy field crosses the phantom barrier (weff = −1) while keeping the equation of state of the quintessence field wϕ > −1. With appropriate choices of parameters, weff crosses the phantom divide around redshift z ∼ 0.5, transitioning from weff < −1 in the past to weff > −1 today. This explains DESI observations well. Our analysis reveals that the model remains consistent within the 2σ confidence intervals provided by DESI for several combinations of the scalar field parameters, highlighting its potential in explaining the dynamics of dark energy arising from a simple Yukawa-type long-range interaction in the dark sector. While the current findings offer a promising framework for interpreting DESI observations, future work, including a comprehensive Markov Chain Monte Carlo (MCMC) analysis, is necessary to constrain the parameter space further and strengthen the statistical significance of the results