 IIA SAHU, D. K
JWST and Ground-based Observations of the Type Iax Supernovae SN 2024pxl and SN 2024vjm: Evidence for Weak Deflagration Explosions
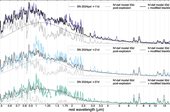
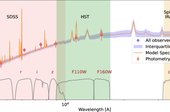
We present panchromatic optical + near-infrared (NIR) + mid-infrared (MIR) observations of the intermediate-luminosity Type Iax supernova (SN Iax) 2024pxl and the extremely low-luminosity SN Iax 2024vjm. JWST observations provide unprecedented MIR spectroscopy of SN Iax, spanning from +11 to +42 day past maximum light. We detect forbidden emission lines in the MIR at these early times while the optical and NIR are dominated by permitted lines with an absorption component. Panchromatic spectra at early times can thus simultaneously show nebular and photospheric lines, probing both inner and outer layers of the ejecta. We identify spectral lines not seen before in SN Iax, including [Mg ii] 4.76 μm, [Mg ii] 9.71 μm, [Ne ii] 12.81 μm, and isolated O i 2.76 μm that traces unburned material. Forbidden emission lines of all species are centrally peaked with similar kinematic distributions, indicating that the ejecta are well mixed in both SN 2024pxl and SN 2024vjm, a hallmark of pure deflagration explosion models. Radiative transfer modeling of SN 2024pxl shows good agreement with a weak deflagration of a near-Chandrasekhar-mass white dwarf, but additional IR flux is needed to match the observations, potentially attributable to a surviving remnant. Similarly, we find SN 2024vjm is also best explained by a weak deflagration model, despite the large difference in luminosity between the two supernovae. Future modeling should push to even weaker explosions and include the contribution of a bound remnant. Our observations demonstrate the diagnostic power of panchromatic spectroscopy for unveiling explosion physics in thermonuclear supernovae.
 IIA PIYALI CHATTERJEE
The relation between solar spicules and magnetohydrodynamic shocks
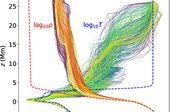
Spicules are thin, elongated, jet-like features seen in observations of the solar atmosphere, at the interface between the solar photosphere and the corona. These features exhibit highly complex dynamics and are a necessary connecting link between the cooler, denser solar chromosphere and the extremely hot, tenuous corona. In this work, we explore the spatial and temporal relation between solar spicules and magnetohydrodynamic (MHD) shocks using data from a 2D radiative MHD simulation of the solar atmosphere driven by solar convection. Here, we demonstrate, through direct identification, that slow MHD shocks, which propagate along magnetic field lines, are regions of strong positive vertical acceleration of the plasma that forms the tip of the spicule material during its rise phase. We quantify the effect of pressure and Lorentz forces on the acceleration of the plasma inside the shocks during the rise of spicules. The causality between spicule and shock propagation in the atmosphere of the model is also investigated. It is further shown that the strength of these shocks may play a vital role in determining the height of the spicules, supporting the idea that shocks act as drivers of some spicules. In addition, we also find the presence of structures similar to propagating coronal disturbances (PCDs) in the simulation, linked with the spicules. Here, PCDs appear to be associated with the shock waves driving the spicules that subsequently propagate into the corona and have similar speeds to those reported in observations.
 IIA RAM SAGAR
Dynamical signatures of trumpler 19: a statistical and photometric perspective
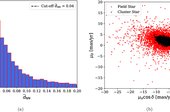
We present a statistical approach to investigating the dynamical evolution of the old open cluster Trumpler 19. We identified 810 cluster members using an ensemble-based unsupervised machine learning method applied to Gaia Data Release 3 astrometric data. From the color–magnitude diagram, we identified 18 blue straggler stars (BSSs) in Trumpler 19. The mass function of the cluster shows a flatter slope, indicating strong mass segregation and advanced dynamical evolution. We fitted the radial surface density profile and found that the concentration parameter c > 1, suggesting that the cluster has formed a clear core–halo structure as a result of dynamical evolution. We characterized the mass segregation among the cluster members as well as BSSs using the Minimum Spanning Trees method, indicating a significant central concentration. Additionally, the sedimentation level of the BSSs is measured as Arh+=0.28±0.05 , further supporting radial segregation. To probe the BSS formation mechanisms, we estimated their fractional mass excess (Me), supporting binary mass transfer and mergers as the dominant channels. This is further supported by the presence of six variable BSSs. The dynamical evolution of the cluster is further assessed through its tidal interaction with the Galaxy. Trumpler 19 appears to be within the tidal regime, where strong Galactic tidal forces have a significant influence on the dynamical evolution. This indicates that the cluster may have undergone significant mass-loss processes, potentially leading to its eventual disruption, which is further supported by the orbit analysis of the cluster. We found that Trumpler 19 may have lost more than 95% of its initial mass due to dynamical evolution.
 IIA STALIN, C. S
Radio Morphology of Gamma-Ray Sources. II. Giant Radio Galaxies
Giant radio sources, including galaxies and quasars (hereafter GRSs), are active galactic nuclei (AGN) hosting relativistic jets with source sizes exceeding a projected length of 0.7 Mpc. They are crucial to understanding the evolution of radio sources and their interaction with the surrounding environment. Some of these enigmatic objects, e.g., NGC 315, have also been reported as γ-ray emitters. Since GRSs are thought to be aligned close to the plane of the sky, they are invaluable targets to explore the radiative mechanisms responsible for the observed γ-ray emission. We have carried out a systematic search of γ-ray-emitting GRSs using sensitive low-resolution radio surveys, such as by the Low Frequency Array, NRAO Very Large Array Sky Survey, and Rapid ASKAP Continuum Survey, and considering the fourth data release of the fourth Fermi Large Area Telescope γ-ray source (4FGL-DR4) catalog. By carefully inspecting the radio maps of all AGN included in the 4FGL-DR4 catalog, we have identified 16 γ-ray-emitting GRSs, including eight that are being reported as GRSs for the first time. Some of their observed parameters, e.g., core dominance, appeared to differ from those found for the non-γ-ray detected GRS population, possibly due to the relatively small viewing angle of the γ-ray-emitting jet. The observed γ-ray properties of these objects were found to be similar to those of non-GRS γ-ray-emitting misaligned AGN. We conclude that the origin of the γ-ray emission could be similar in both source populations.
 IIA SMITHA SUBRAMANIAN
Stromgren photometric metallicity map of the magellanic cloud stars using Gaia DR3–XP spectra
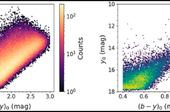
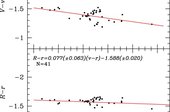
One key to understanding a galaxy’s evolution is studying the consequences of its past dynamical interactions that have influenced its shape. By measuring the metallicity distribution of stellar populations with different ages, one can learn about these interactions. The Magellanic Clouds, being the nearest pair of interacting dwarf galaxies with a morphology characterised by different tidal and kinematic sub-structures as well as a vast range of stellar populations, represent an excellent place to study the consequences of dwarf-dwarf galaxy interactions and the interactions with their large host, the Milky Way. Aims. We aim to determine the metallicities ([Fe/H]) of red giant branch (old) and supergiant (young) stars covering the entire galaxies, estimate their radial metallicity gradients, and produce homogeneous metallicity maps. Methods. We used the XP spectra from Gaia Data Release 3 to calculate synthetic Strömgren magnitudes from the application of the GaiaXPy tool and adopted calibration relations from the literature to estimate the photometric metallicities. Results. We present photometric metallicity maps for ∼90 000 young stars and ∼270 000 old stars within ∼11 deg of the Small Magellanic Cloud and ∼20 deg of the Large Magellanic Cloud from a homogeneous dataset. We find that the overall radial metallicity gradients decrease linearly, in agreement with previous studies. Thanks to the large stellar samples, we could apply piecewise-regression fitting to derive the gradients within different radial regions. The catalogues containing the estimated photometric metallicities from this work are made available at the CDS. Conclusions. The overall metallicity gradients, traced by young and old stars, decrease from the centre to the outskirts of both galaxies. However, they show multiple breakpoints, depicting regions following different and sometimes opposite trends. These are associated with the structure of the galaxies and their history of star formation and chemical evolution but may be influenced by a low number of sources, especially at the centre (due to crowding) and in the outermost regions.
 IIA RAJU, K. P
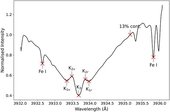
Variations of the Ca II K line profile parameters with solar latitude and time observed from Kodaikanal Solar Observatory
The Ca-K line profiles as functions of solar latitude and time were obtained through our observations from the Kodaikanal Solar Observatory using the solar tunnel telescope and spectrograph with a CCD detector. Observations were conducted on all days with favourable sky conditions. We analysed the data collected over a period of about 10 yr to study the variations in the Ca II K line profiles recorded between 2015 and 2024, of which 709 d of data were found useful. The temporal and time-averaged latitudinal variations of the K1 width, K2 width, K3 intensity and the intensity ratios of K2v/K2r and K2v/K3 were computed using a semi-automated program. The parameters showed asymmetric increases towards the higher latitudes, with the rates of increase being higher in the Southern hemisphere. The temporal plots for K1 width and K3 intensity showed positive correlations with the plage and spot filling factors, whereas the temporal plots for K2 width, K2v/K2r, and K2v/K3 intensity ratios showed negative correlations. The time-averaged latitudinal plot for K1 width has small peaks near 25◦N and 20◦S. The K2 width has a small peak at 0◦. The K3 intensity has peaks at 20◦N and 15◦S. The K2v/K2r intensity ratio shows peaks at 50◦N, 0◦, and 40◦S. The K2v/K3 intensity ratio shows peaks at 60◦N, 0◦, and 60◦S. Slope profiles show spectral response to magnetic activity peaks near K3 with north–south asymmetries. Such variations in the line profiles are important in the studies of solar irradiance, surface flux transport, and solar dynamo.
 IIA MUNEER, S
The variable stars in the compact halo globular cluster NGC 5634 visited again
We present new time-series CCD VR photometry of the globular cluster NGC 5634. We aim to use the known RR Lyrae stars, members of the cluster, as indicators of mean metallicity and distance. Accurate coordinates, periods, and an identification chart of the variables in the field of our images are provided. A membership analysis was performed, based on Gaia-DR3 proper motions, for 3525 point sources within 15 arcmin from the cluster centre. The membership status for each known variable was established and it was found that V10, V11, and V16 are most likely field stars. The variability of the RRab star V7, considered non-variable for a number of years, is demonstrated. Via the Fourier decomposition of the light curves of cluster member RR Lyrae, the mean metallicity and distance were calculated independently from RRab and RRc stars to find [Fe/H]ZW = −1.67 ± 0.11 y D = 23.9 ± 0.8 kpc, and [Fe/H]ZW = −1.69 ± 0.22 y D = 22.9 ± 1.0 kpc, respectively.
 IIA ARVIND BALASUBRAMANIAN
Constraining the nature and long-term stability of FRB 20121102A’s persistent radio source
The persistent radio source (PRS) associated with FRB 20121102A, the first precisely localized repeating fast radio burst (FRB), provides key constraints on both its local environment and the nature of the underlying FRB engine. We present a seven-year (2016–2023) temporal analysis of the PRS, combining new uGMRT observations with archival data across L-band frequencies. We find no statistically significant long-term trend in its L-band flux density. The observed variability is consistent with refractive interstellar scintillation, and the data do not require the PRS to be a source exhibiting strong intrinsic variability. This stability challenges models predicting rapid fading from evolving magnetized outflows, such as those powered by young magnetars or relativistic shocks. Our low-frequency observations show no evidence for spectral evolution between 1.4 GHz and 745 MHz, with a measured spectral index of α = −0.15 ± 0.08, in agreement with values reported from earlier observations in 2016–2017. The PRS remains compact, exhibits a flat radio spectrum, and—if powered by an intermediate-mass black hole accreting at a low Eddington ratio—its radio and X-ray properties are broadly consistent with the fundamental plane of radio-loud AGNs. While not conclusive, this scenario represents a viable alternative to magnetar wind nebula models and warrants further investigation. Furthermore, we find no statistically significant correlation between FRB burst activity and the luminosity of associated PRSs among repeating sources. This apparent decoupling challenges simple progenitor models that directly link bursts and persistent emission. Together, these results suggest that the FRB engine and PRS may in some systems originate from physically distinct sources, underscoring the need for flexible models to explain the diverse environments of repeating FRBs.
 IIA TANMOY SAMANTA
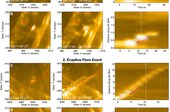
Dynamics of reconnection nanojets in eruptive and confined solar flares
Recent observations reveal small-scale reconnection-driven plasma ejections, often termed nanojets, triggered by magnetic field interactions at slight misalignment angles. These fast, collimated plasma ejections are ∼1.5 Mm long and ∼0.5 Mm wide. In this study, we analyze two high-resolution extreme ultraviolet imaging data sets from the Extreme Ultraviolet Imager on board the Solar Orbiter mission, corresponding to an eruptive (M7.6) and a confined (C1.2) flare, to investigate the dynamics of nanoflare ejections and, for the first time, compare their properties in distinct magnetic environments. We identified 59 nanoflare ejections: 44 in the eruptive flare and 15 in the confined flare event. Our analysis reveals that these events form two distinct classes: confined events exhibit lower speeds (41–174 km s −1) and lower kinetic energies (1020–1022 erg), placing them closely in or near the picoflare energy regime, while eruptive events show higher speeds (131–775 km s−1) and higher kinetic energies (1022–1024 erg), falling within the nanoflare regime. Furthermore, magnetic field extrapolations reveal a highly sheared arcade with greater twist and higher magnetic energy density in the eruptive event, compared to the less twisted configuration in the confined event. We infer that this sheared arcade configuration in the eruptive event creates favorable conditions for higher speeds and kinetic energies, unlike the less braided structure in the confined event. Our findings highlight the crucial role of the surrounding magnetic environment in regulating the energetics of nanoflare ejections in the solar atmosphere.
 IIA SWASTIK, C
Exoplanet classification through vision transformers with temporal image analysis
The classification of exoplanets has been a longstanding challenge in astronomy, requiring significant computational and observational resources. Traditional methods demand substantial effort, time, and cost, highlighting the need for advanced machine learning techniques to enhance classification efficiency. In this study, we propose a methodology that transforms raw light curve data from NASA's Kepler mission into Gramian angular fields (GAFs) and recurrence plots (RPs) using the Gramian angular difference field and RP techniques. These transformed images serve as inputs to the vision transformer (ViT) model, leveraging its ability to capture intricate temporal dependencies. We assess the performance of the model through recall, precision, and F1 score metrics, using a five-fold cross-validation approach to obtain a robust estimate of the model's performance and reduce evaluation bias. Our comparative analysis reveals that RPs outperform GAFs, with the ViT model achieving an 89.46% recall and an 85.09% precision rate, demonstrating its significant ability to accurately identify exoplanetary transits. Despite using undersampling techniques to address class imbalance, data set size reduction remains a limitation. This study underscores the importance of further research into optimizing model architectures to enhance automation, performance, and generalization of the model.